Log Monitoring and Debugging
For efficient monitoring and troubleshooting, the Ditto Hybrid Platform application generates log files containing information on system performance and error states during runtime. These logs, which are handled by Log4J and supplemented by additional files created by Apache Tomcat, are stored in the Apache Tomcat installation directory under the logs folder. To customize the Log4J settings, please refer to the Log4J Configuration Guide.
Since version 2.0.16, the Settings page has been enhanced to include three distinct menu tabs for better log management and configuration:
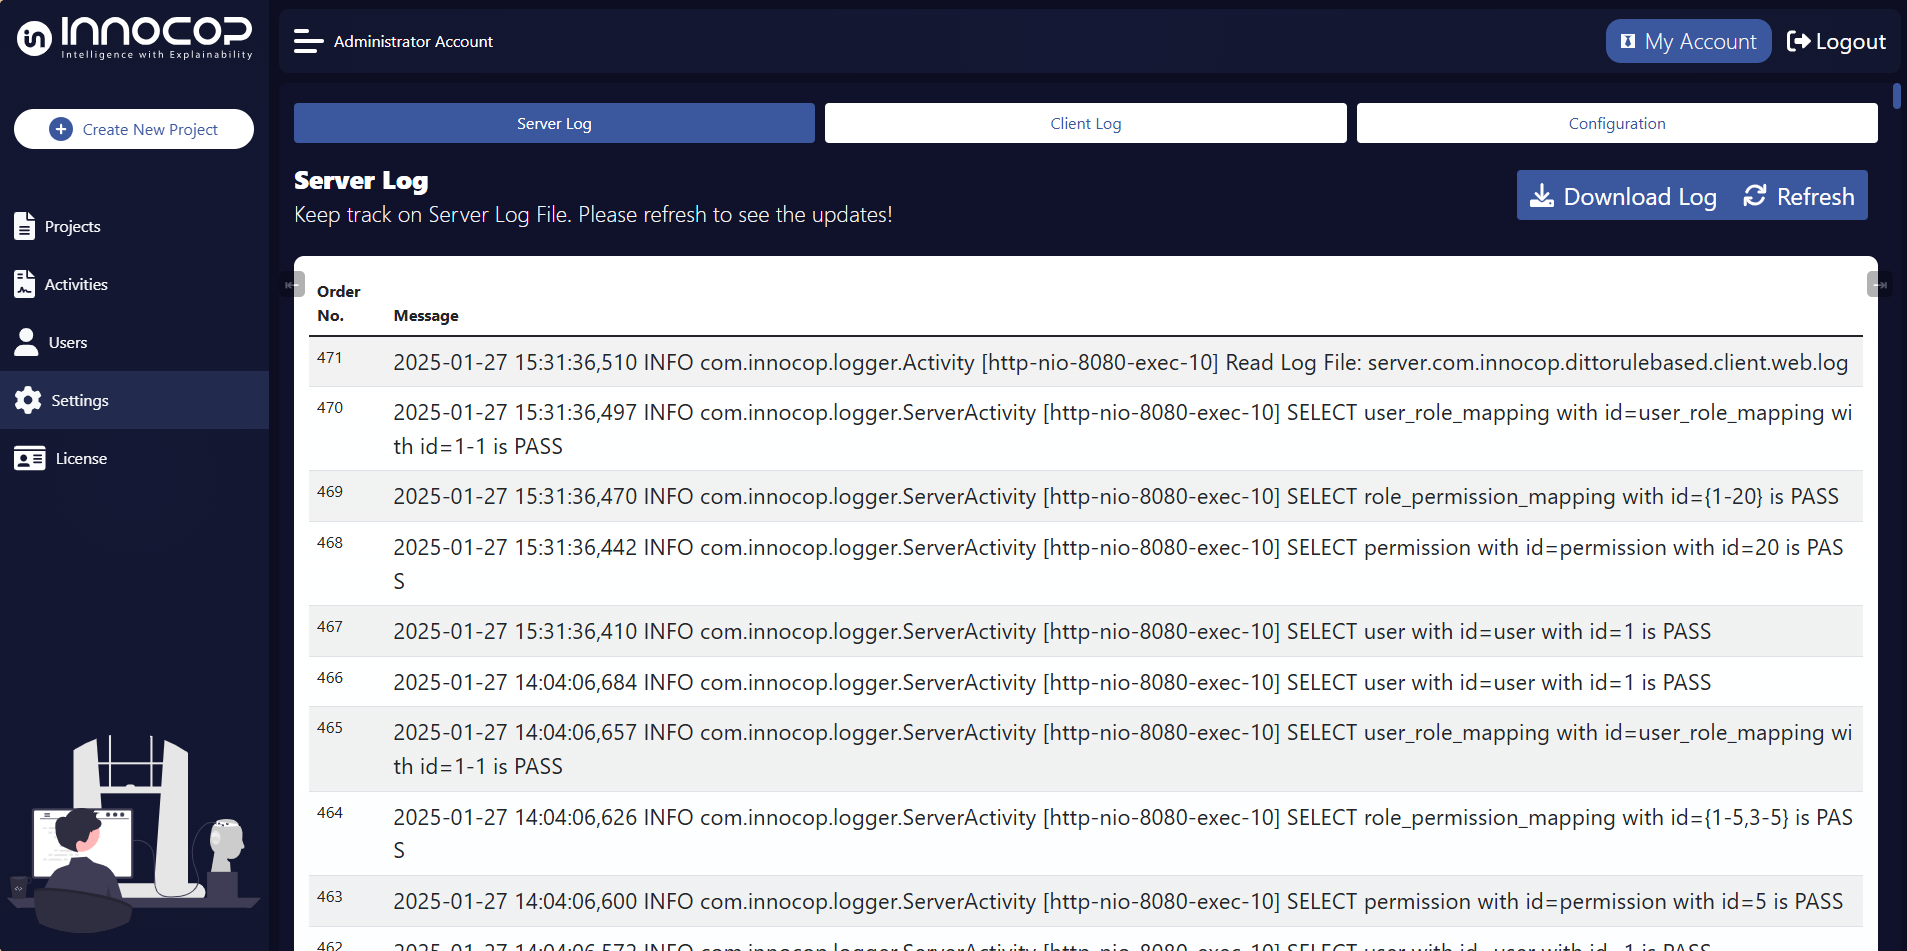
Server Log: This tab provides detailed information regarding backend processes. It is essential for debugging and identifying processes that may have encountered errors.
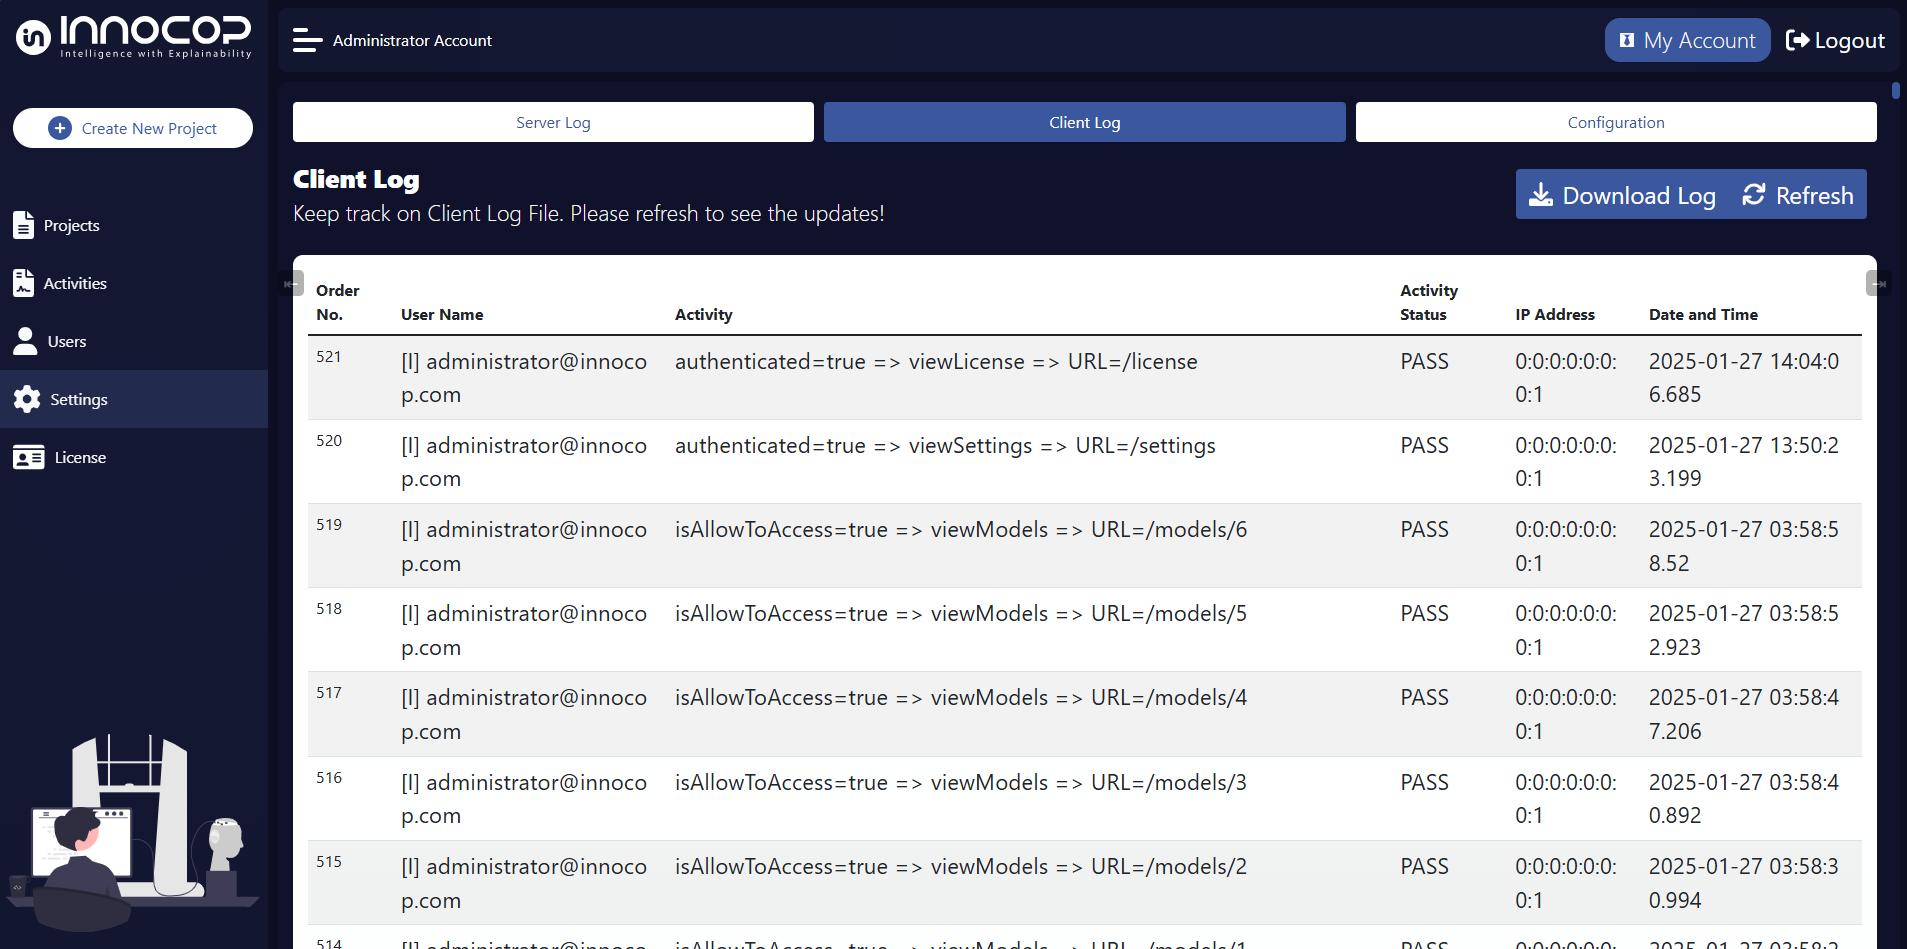
Client Log: Here, user activity is recorded, such as access patterns and interactions within the application, helping to track who accessed specific features or data.
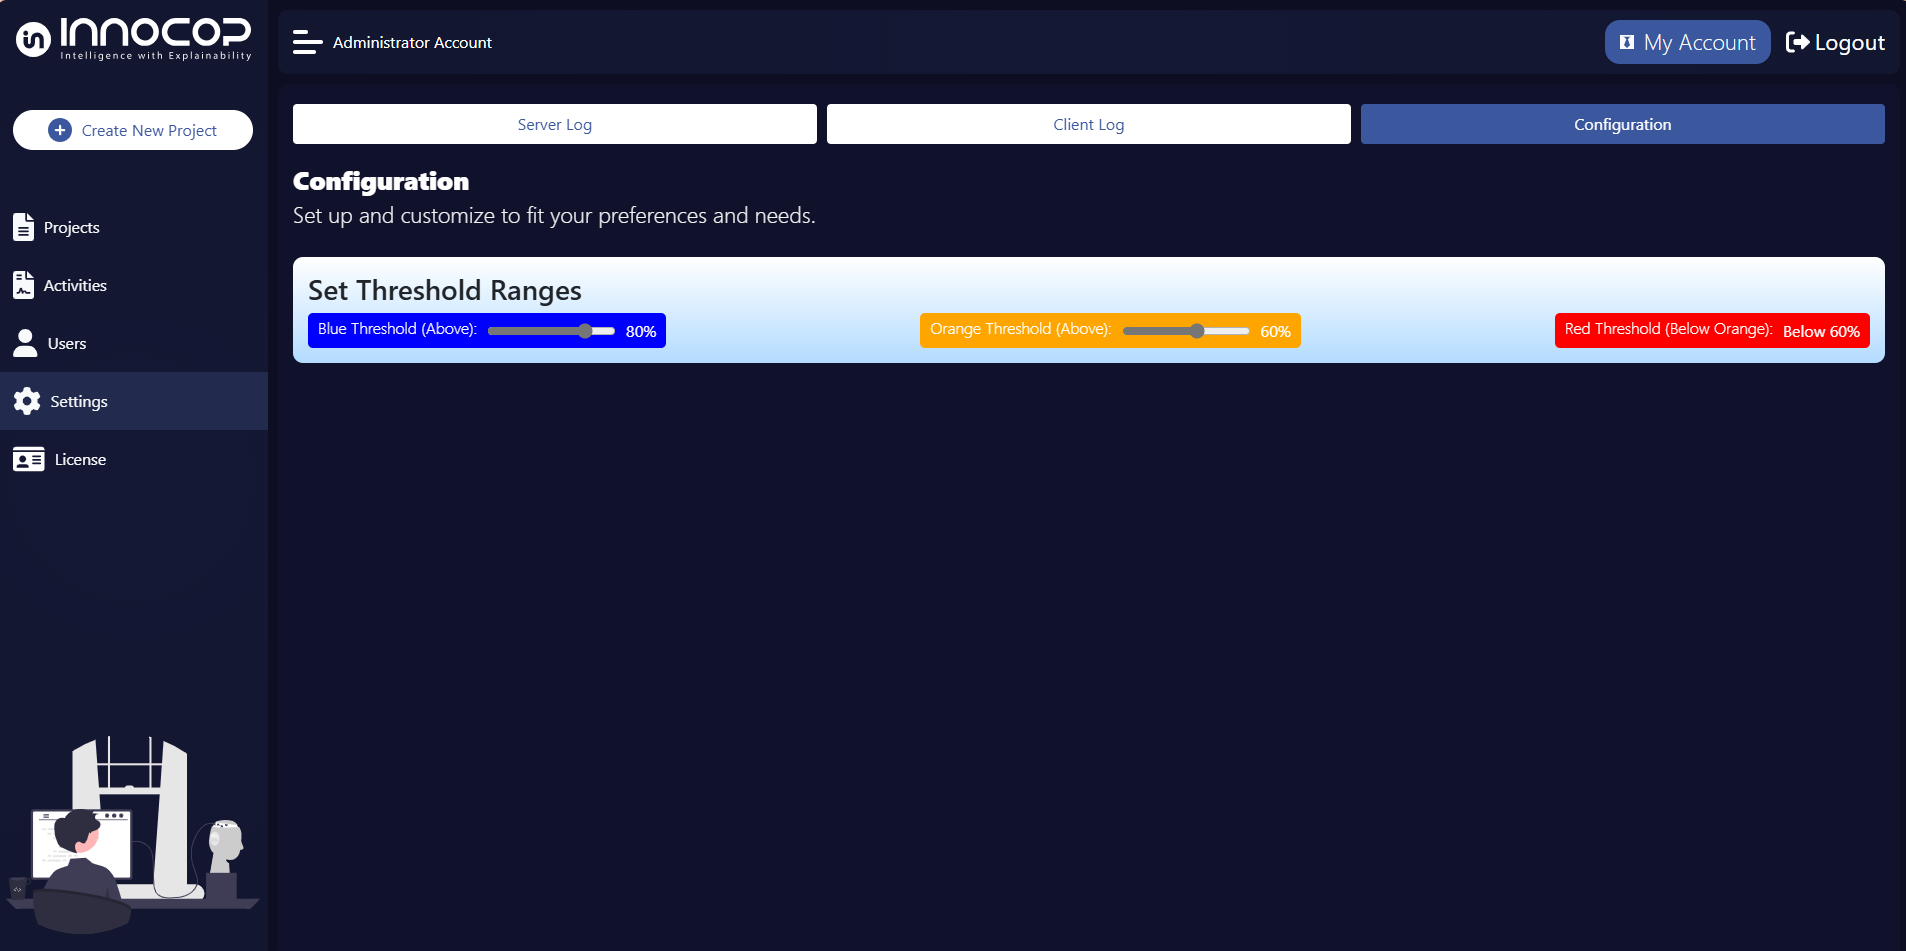
Configuration: This section enables configuration of model node thresholds. Users can set specific threshold values, which will then influence the visual representation of nodes in both the model tree and the model graph. Nodes will be automatically color-coded based on their values relative to the defined thresholds.
Users with appropriate permissions can access these logs through the Settings menu. The following options are available:
Refresh: Use this option to refresh and view the latest updates in the log files.
Download Log: This allows users to download the log file as a Microsoft Excel document, which can then be forwarded to the support team for further analysis.