User Interface
Login
To access the Ditto Hybrid Platform Web Client, please open a web browser and navigate to the URL: http://HOST_SERVER:PORT. For logging in with an Active Directory or any LDAP account, switch to the LDAP User tab and provide all necessary credentials.

Dashboard

Upon successful login, users will be directed to the Dashboard page. Access to specific menu items is restricted based on user roles, ensuring proper permission control.
Feature
Role Administrator
Role User Manager
Role Data Scientist
Role Fraud Officer
Projects

Activities

Users
Settings
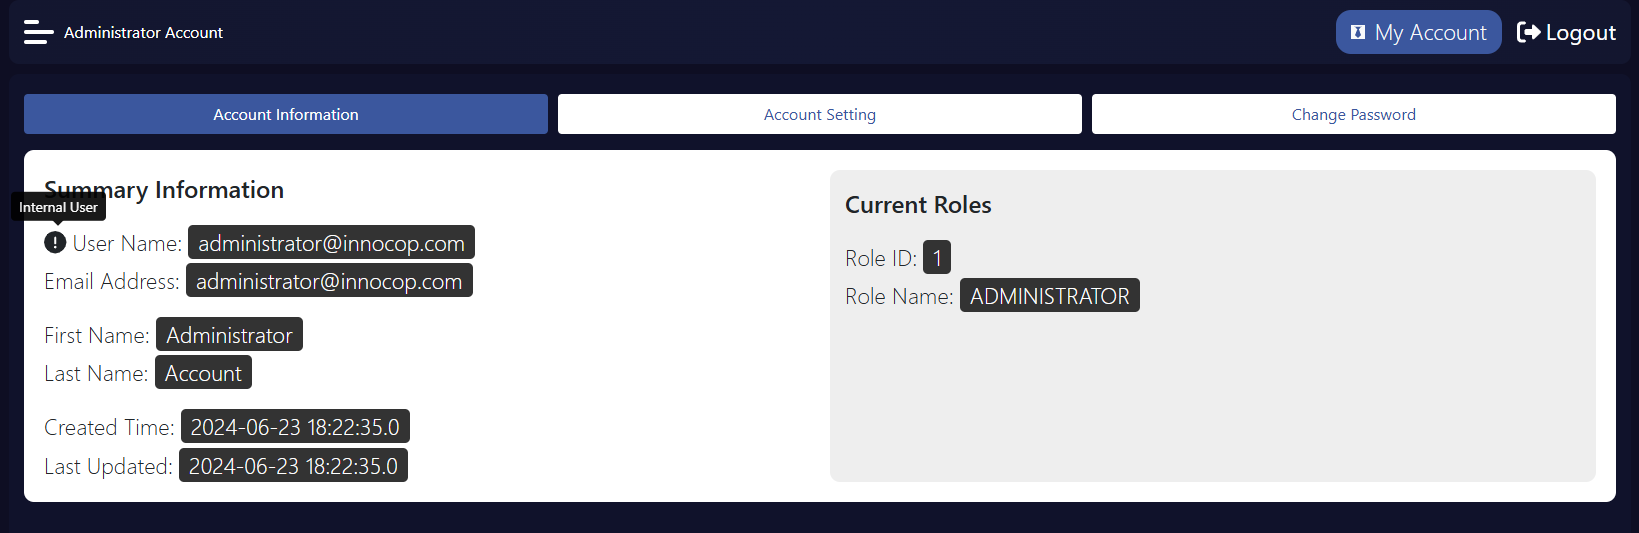
To view detailed user information, select the
My Accountbutton. Hover over the label next toUser Nameto view the user’s role.
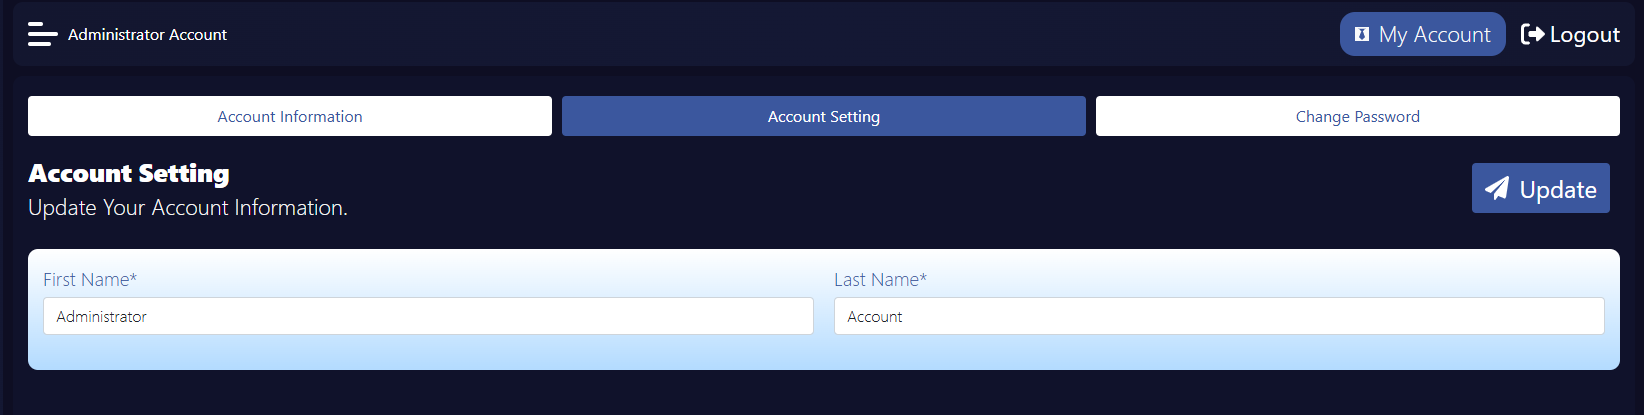
For user information updates, navigate to the
Account Settingtab.
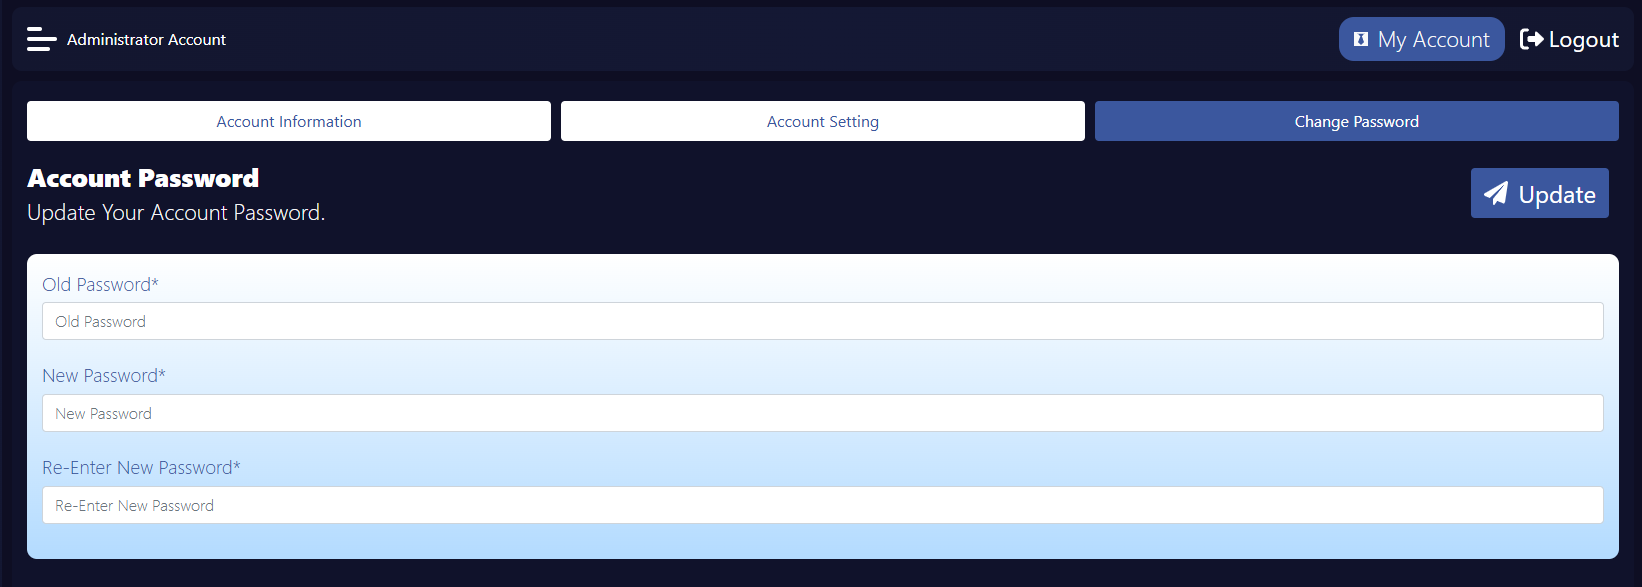
To change the user’s password, select the
Change Passwordbutton.
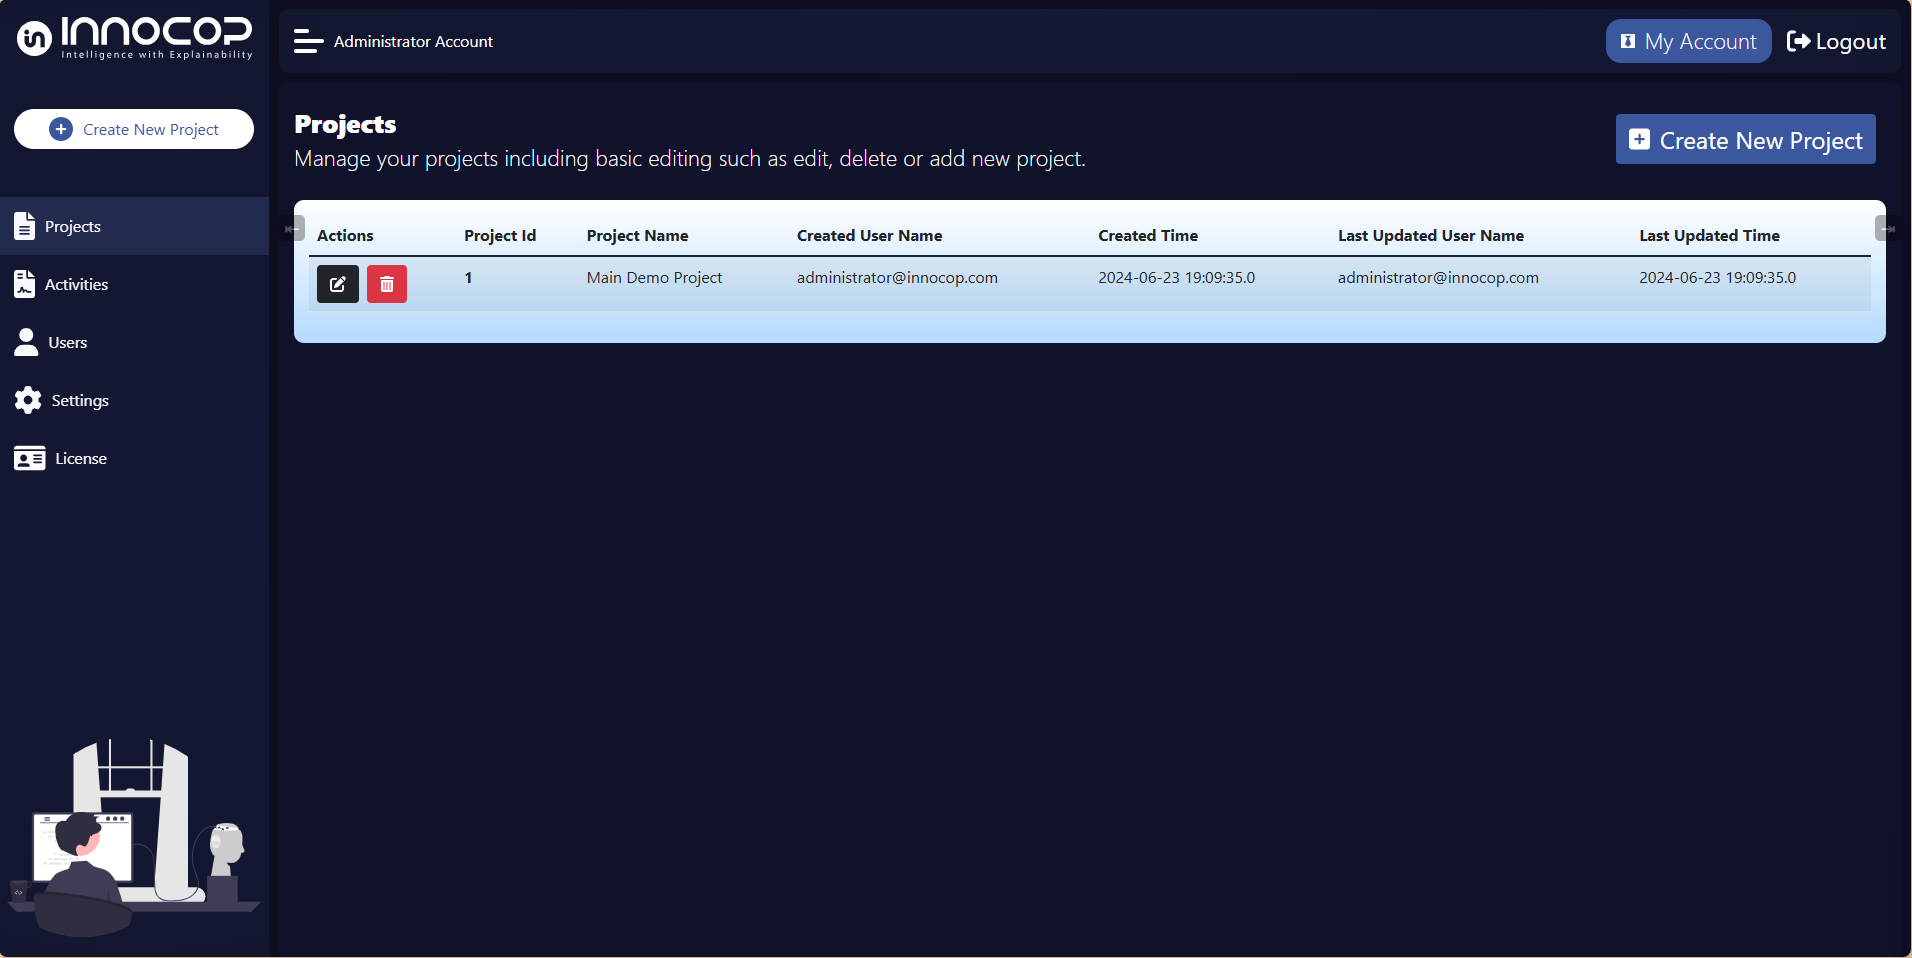
Projects
To access the Projects List, select the Projects option from the left navigation bar. This page displays all available projects. To begin working on a project, click the Edit button beside the corresponding Project ID. To remove a project, click the Delete button. If no projects exist, follow the steps to create a new project.
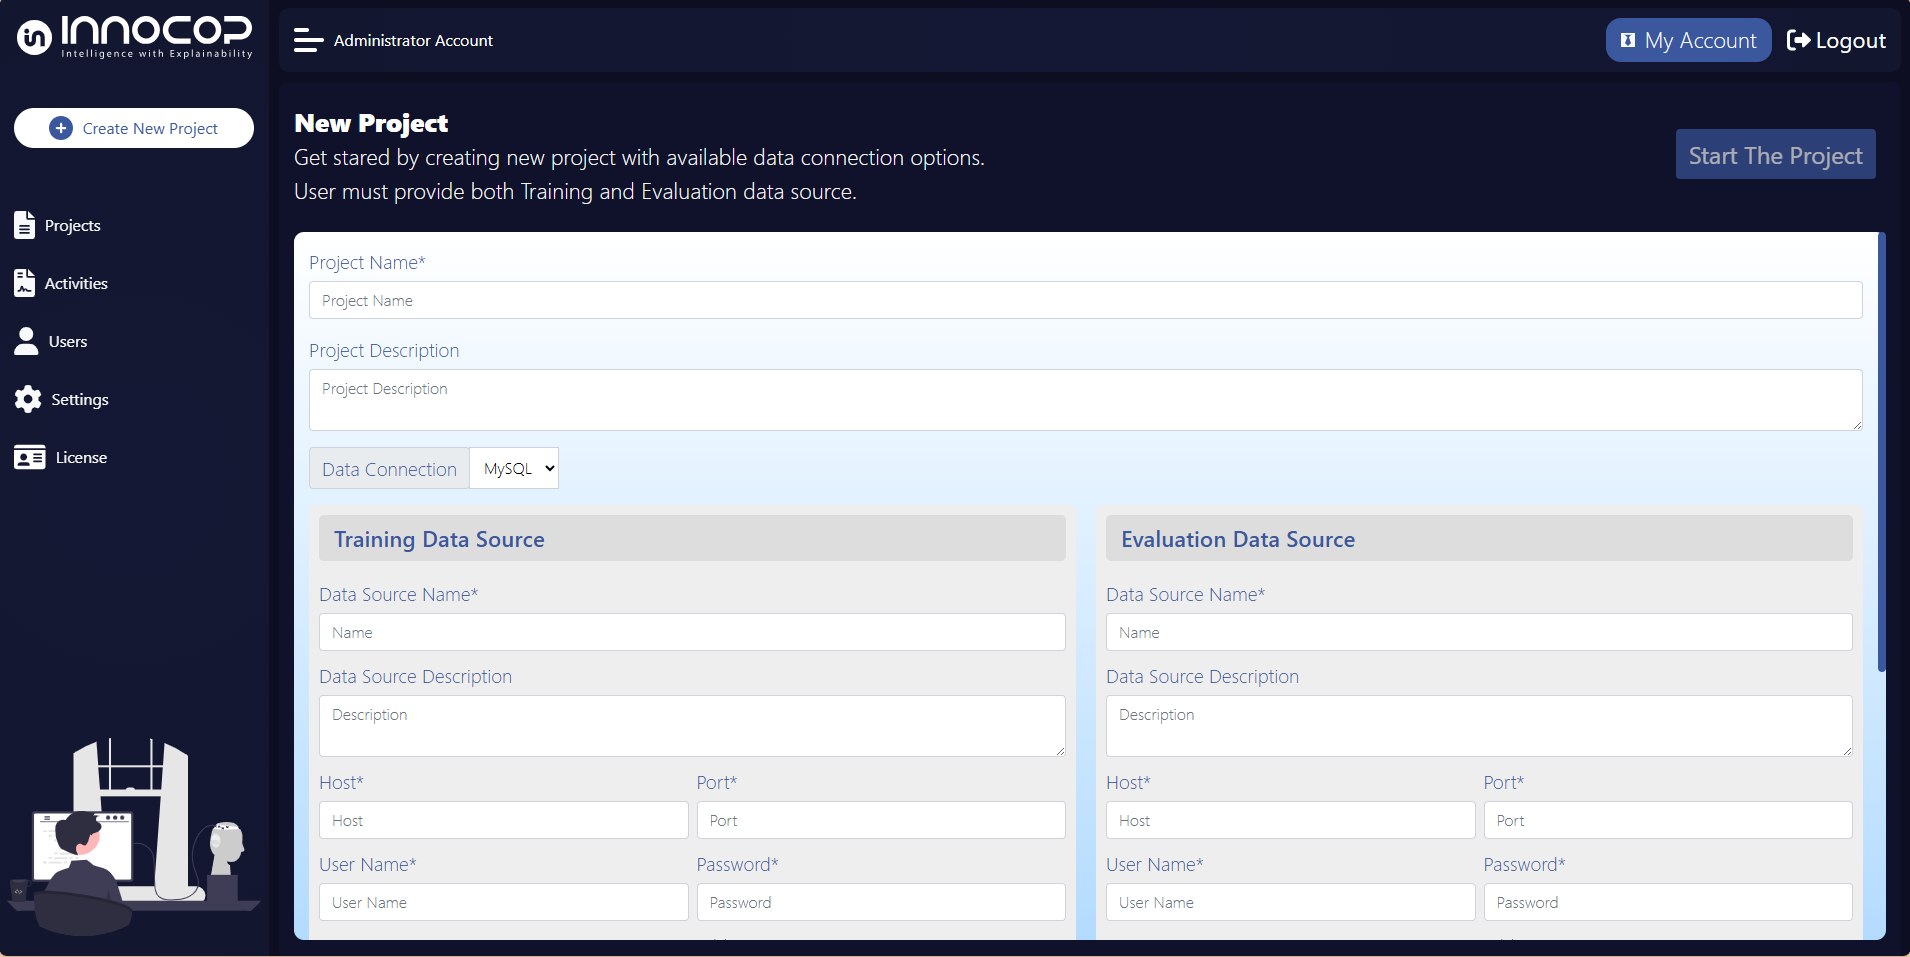
Create New Project
To initiate a new project, click the Create New Project button.
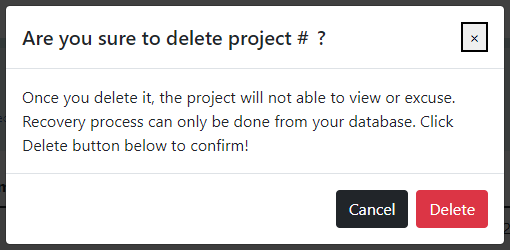
Delete Project
Please note that deleting a project will prompt a confirmation warning. To proceed with deletion, click the Delete button.
Working with Project
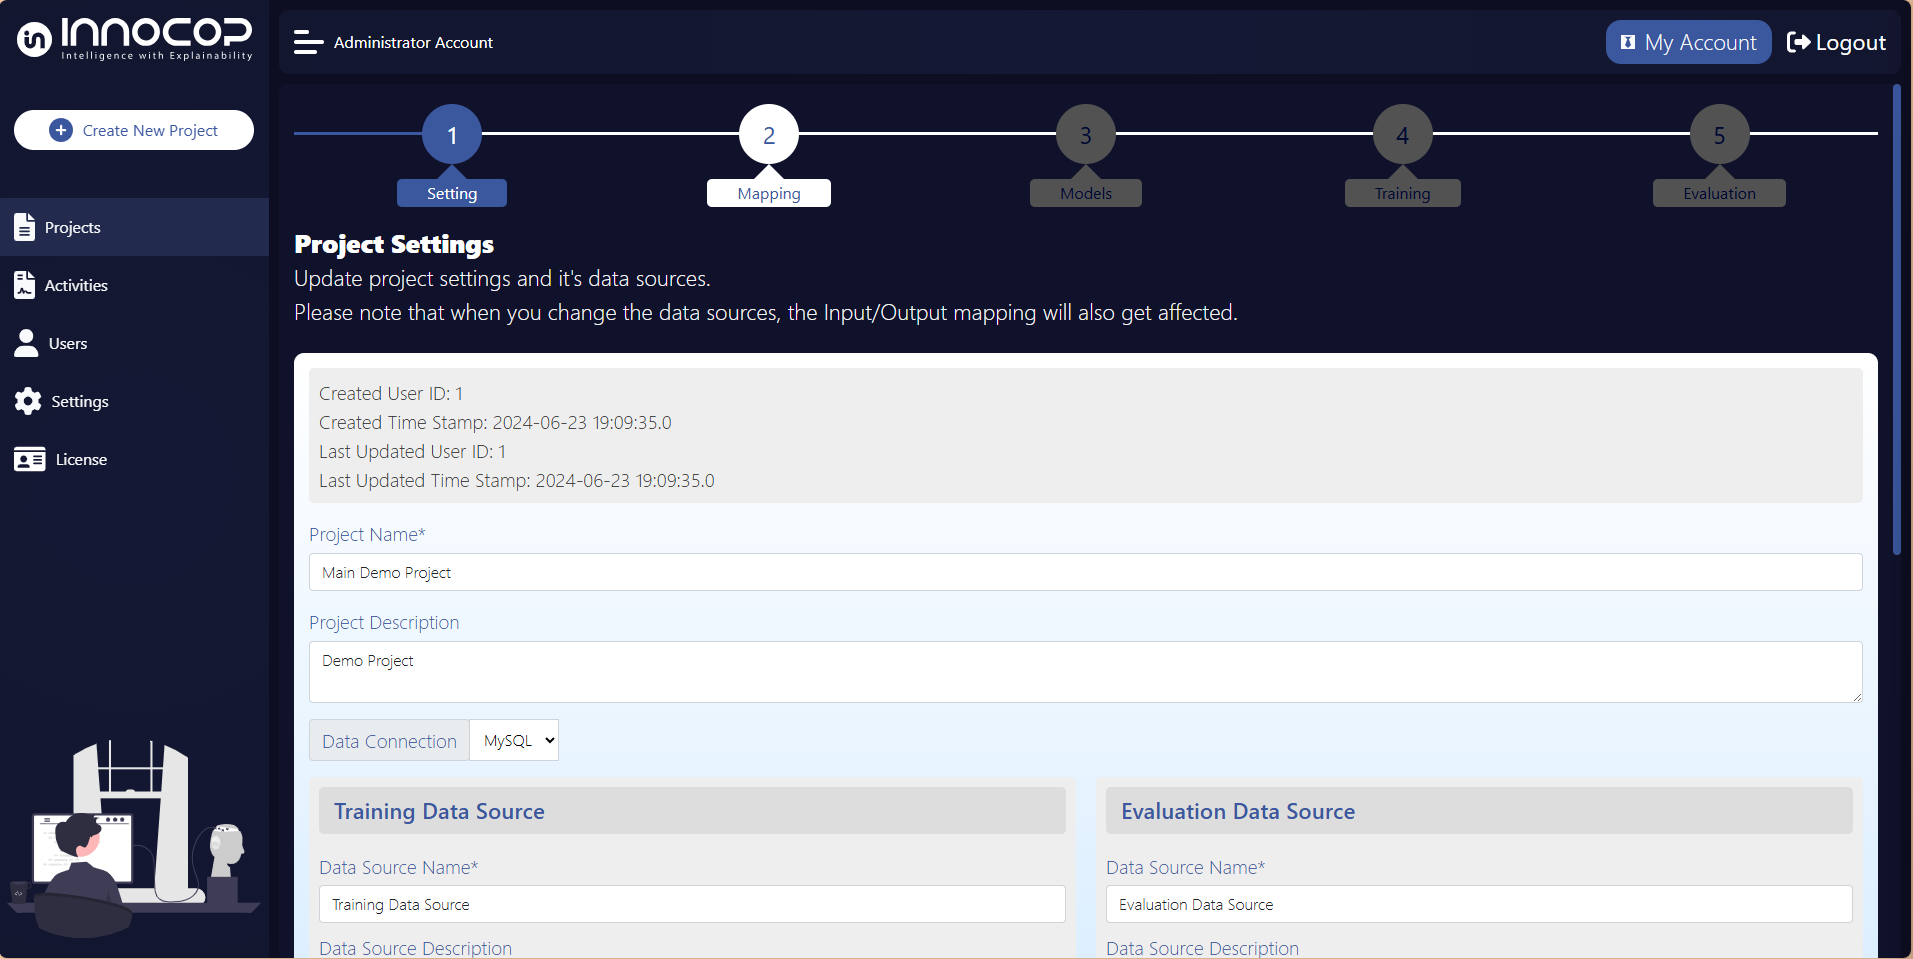
Project Settings
In the Project Settings page, you can update key project details such as the project description and associated data source. If the data source is modified, revalidation is required by selecting the Check Validation button at the bottom of the settings page. To save changes and continue, click the Update Project button.
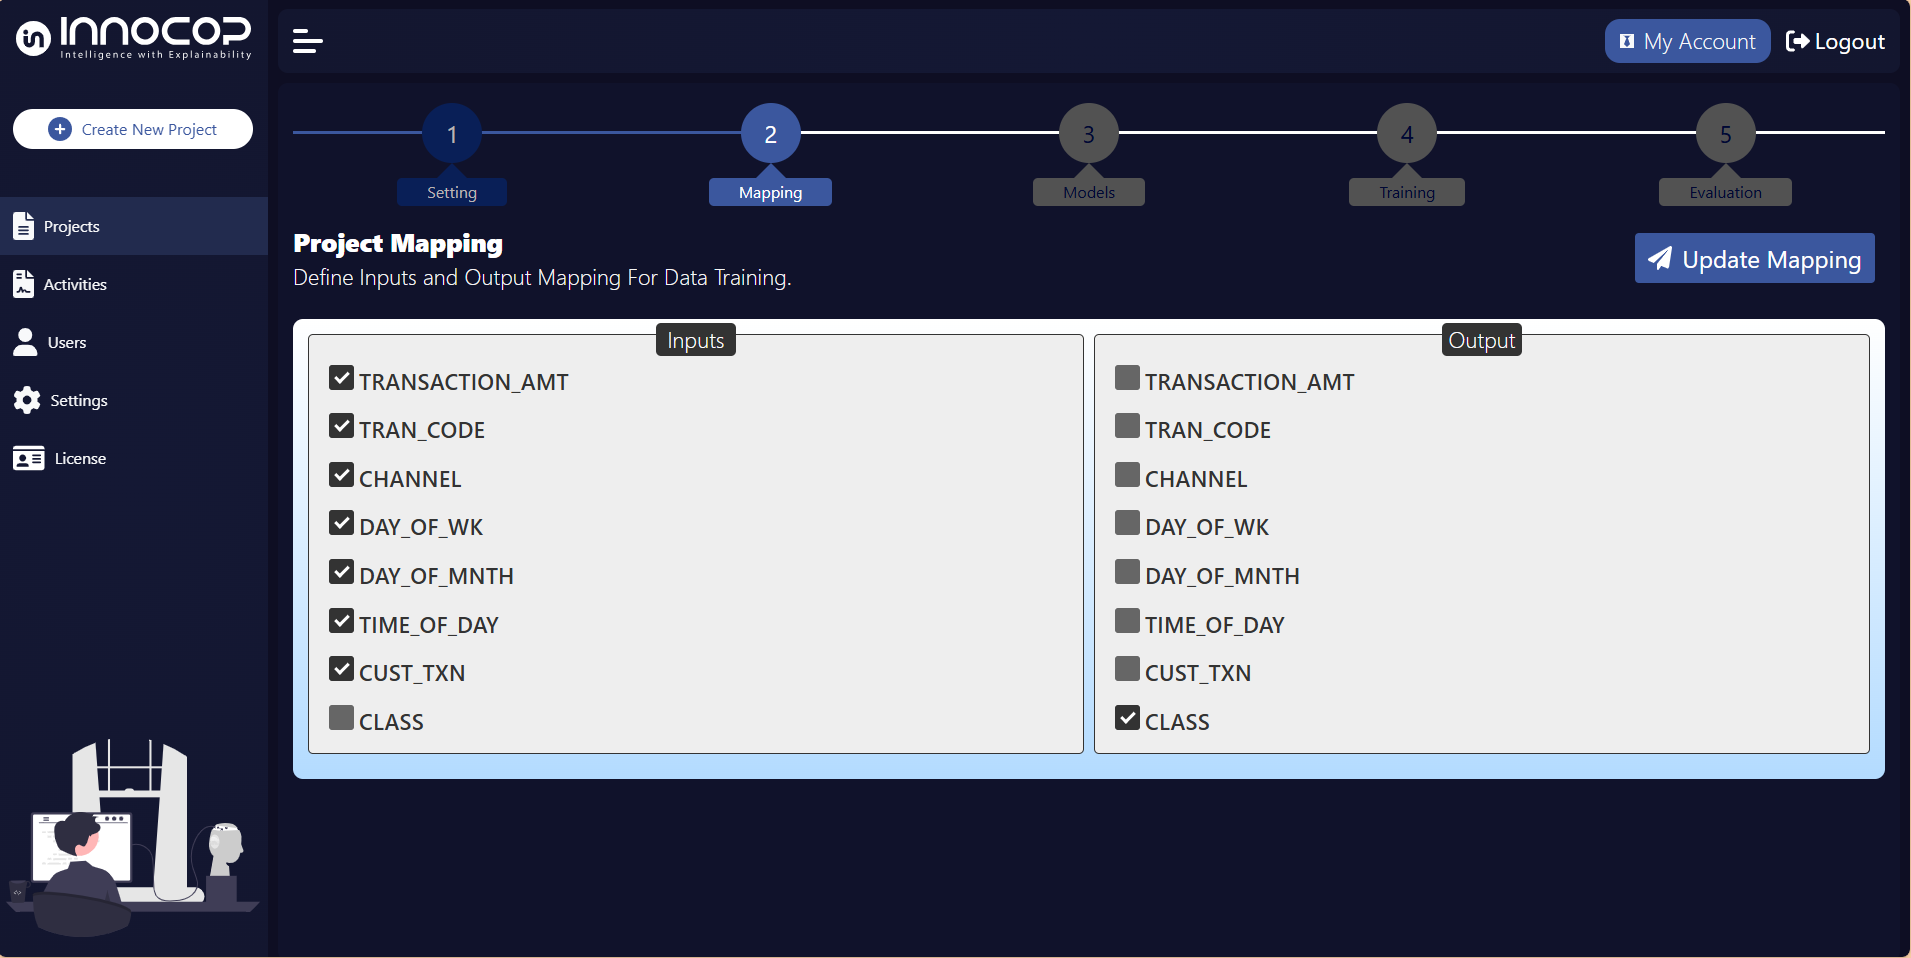
Project Mapping
The Project Mapping page allows you to define the input and output attributes of the data source. This mapping is essential for model training and data evaluation.
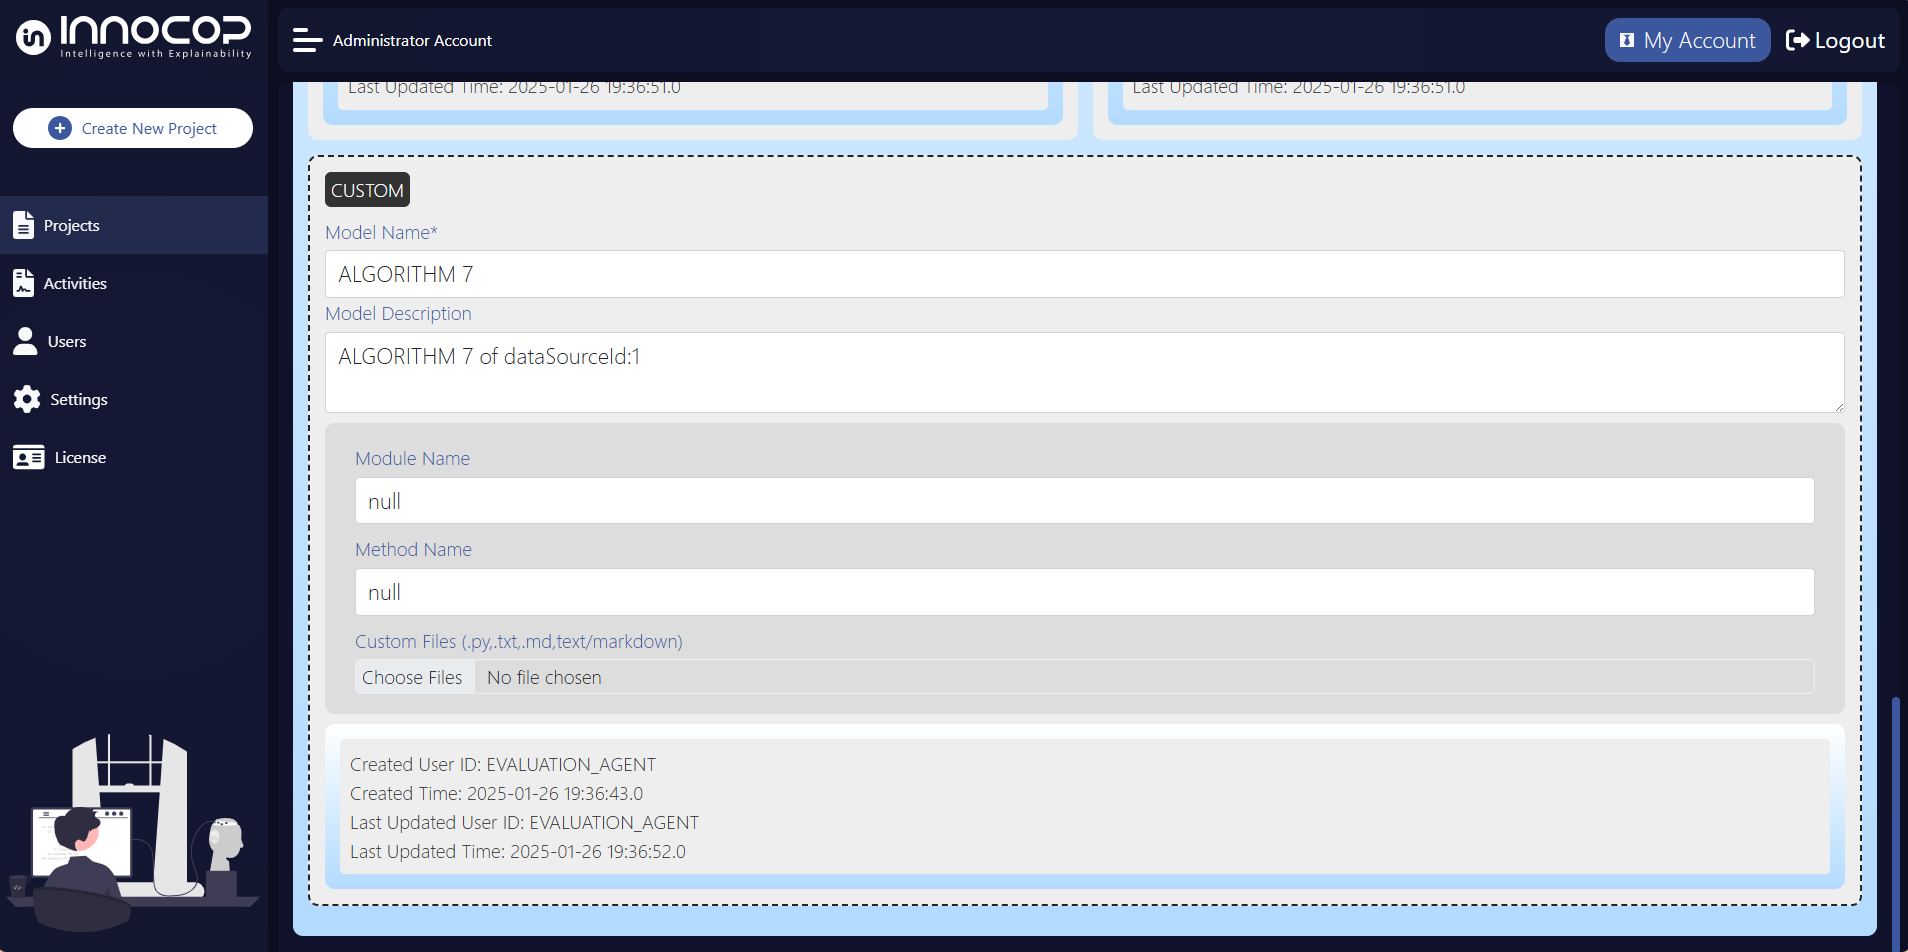
Models
Models can be managed and viewed on the Models page.
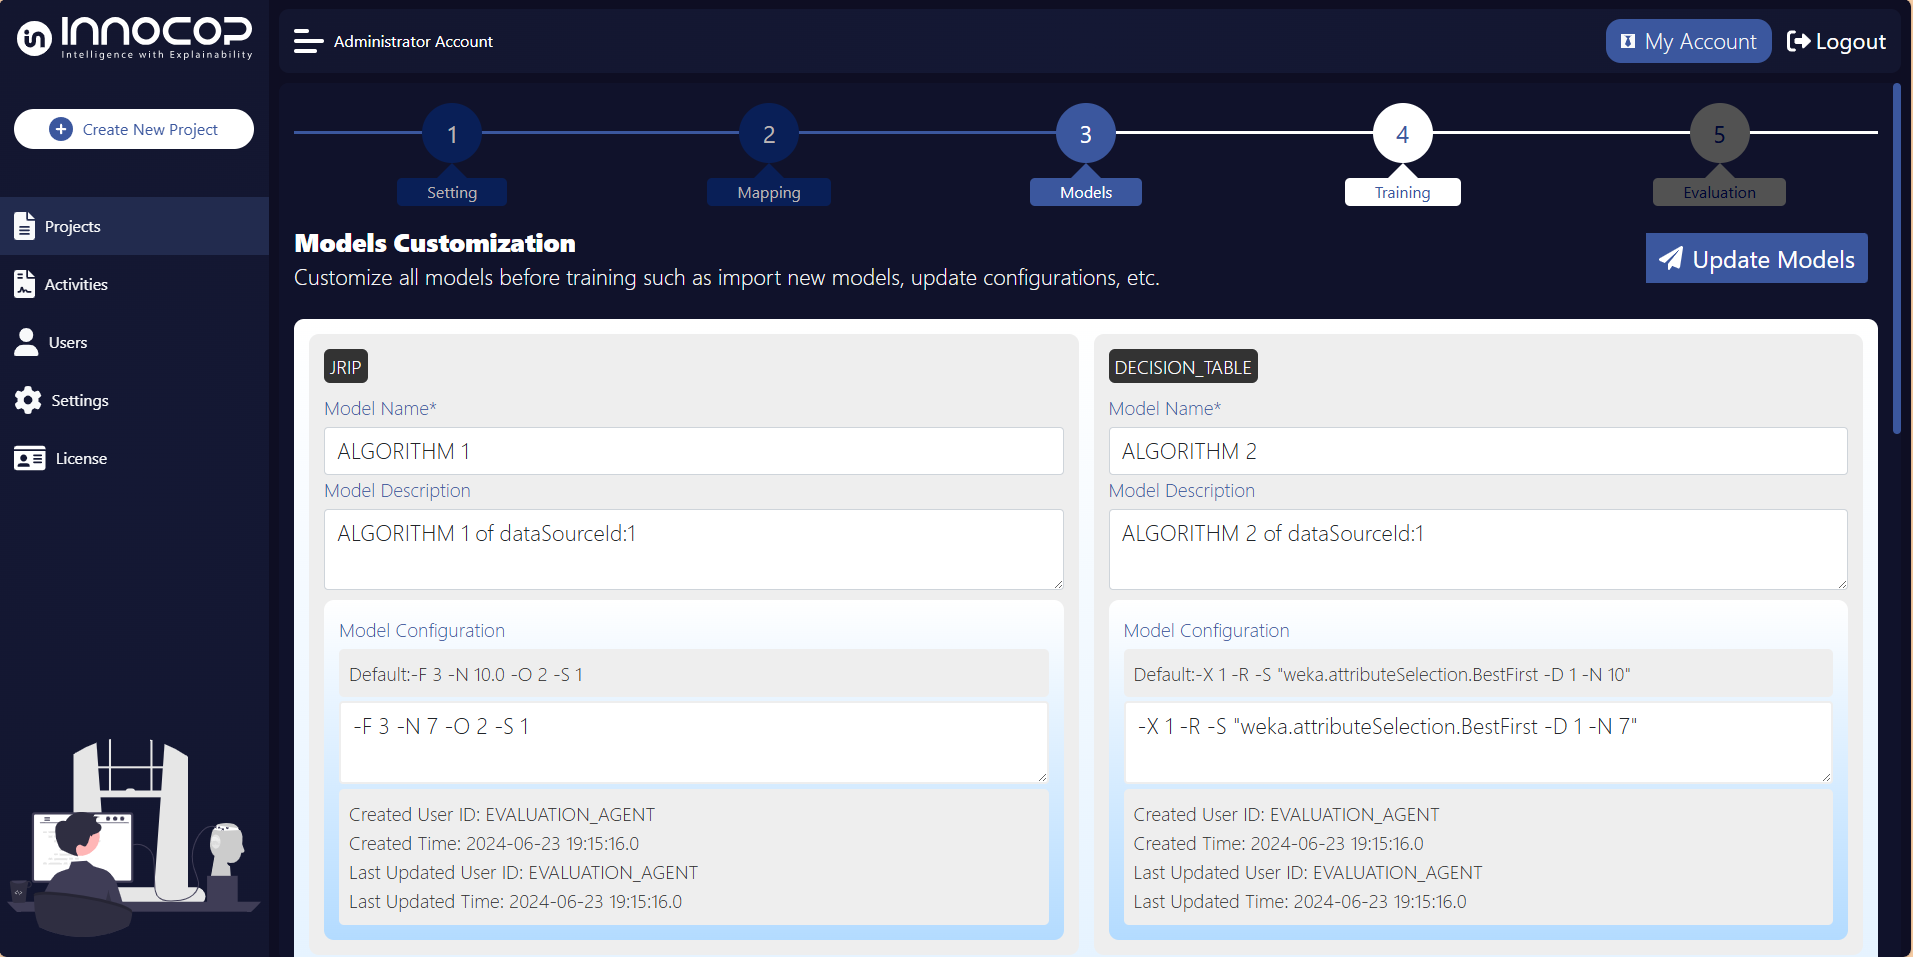
Custom models can also be accessed and edited here.
For a comprehensive guide on model configuration, please refer to the Model section.
Project Training
To train all models using the training data source and predefined input/output mappings, click the Train All Models button.
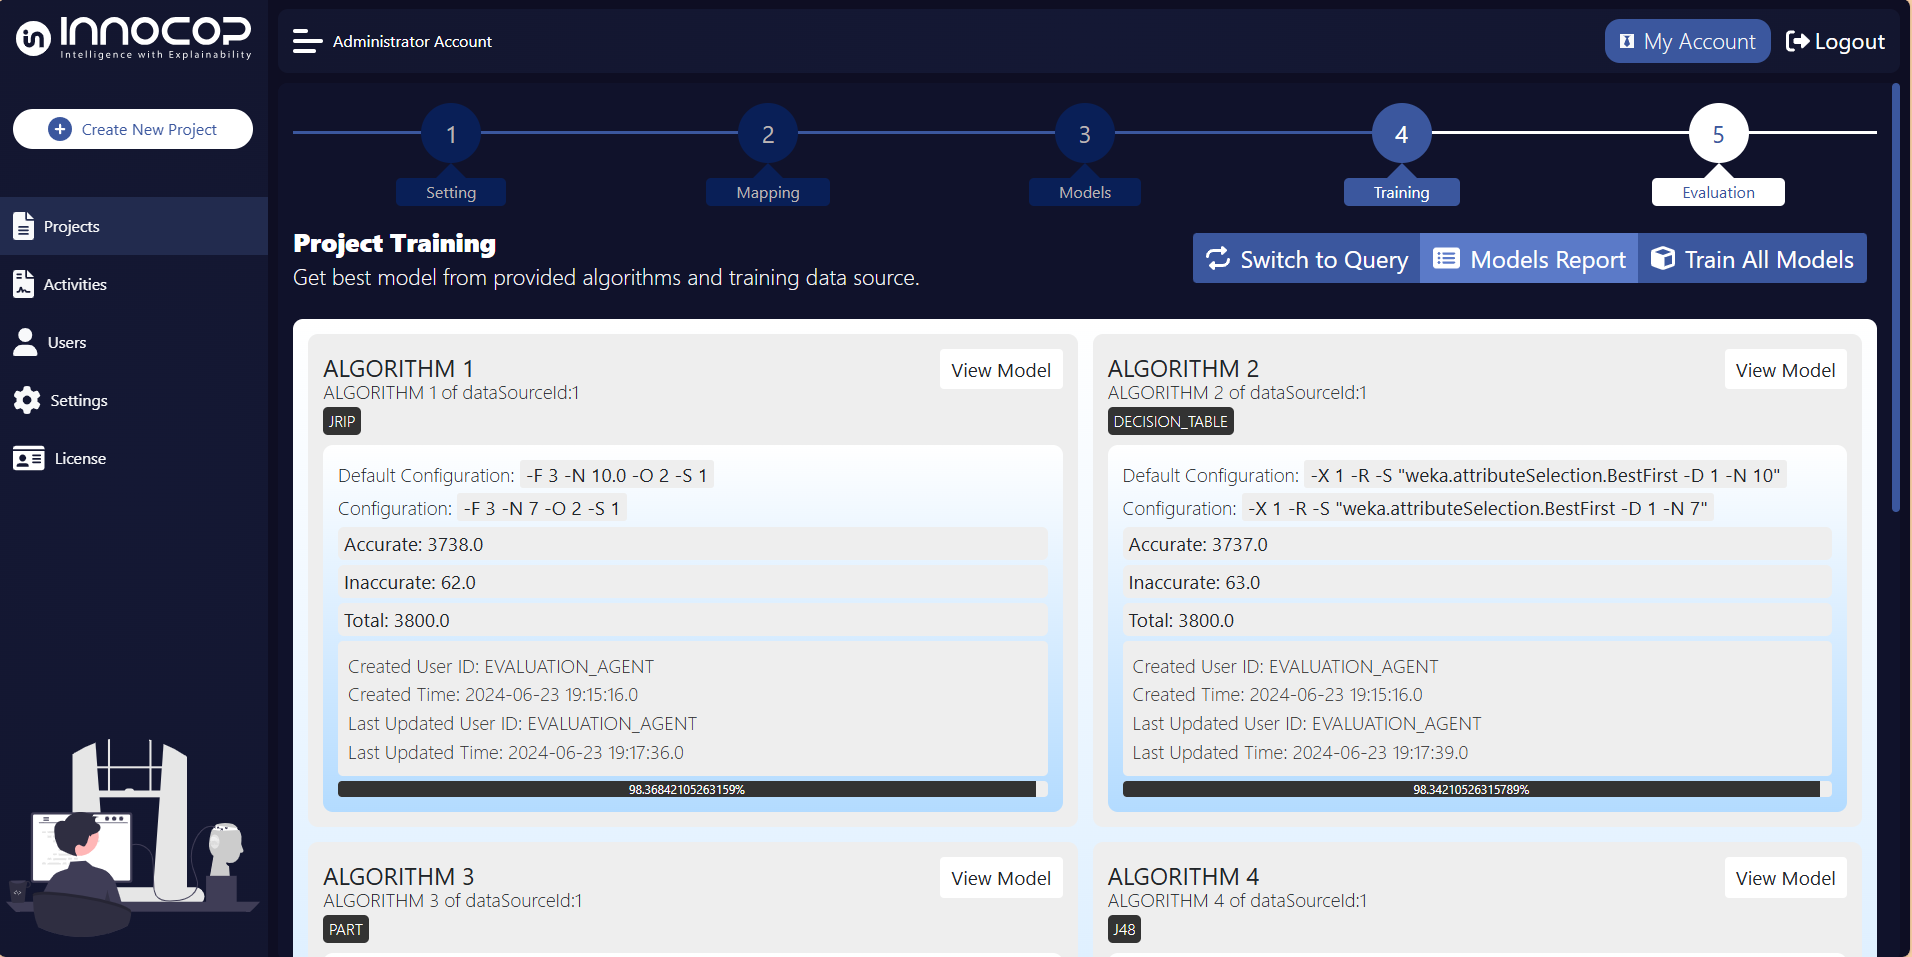
After training all models, one algorithm is automatically chosen as the Selected Model based on its performance. By default, the model with the highest accuracy is selected. The Selected Model is visually highlighted with a dashed box around it for easy identification. In cases where multiple models have the same accuracy, the Random Forest algorithm will be selected as the default model.
This Selected Model can be updated at any time within the
Evaluationtab. You can change the chosen model to any other model that you wish to use for evaluation purposes.This feature has been available since the version 3.0.1 release.
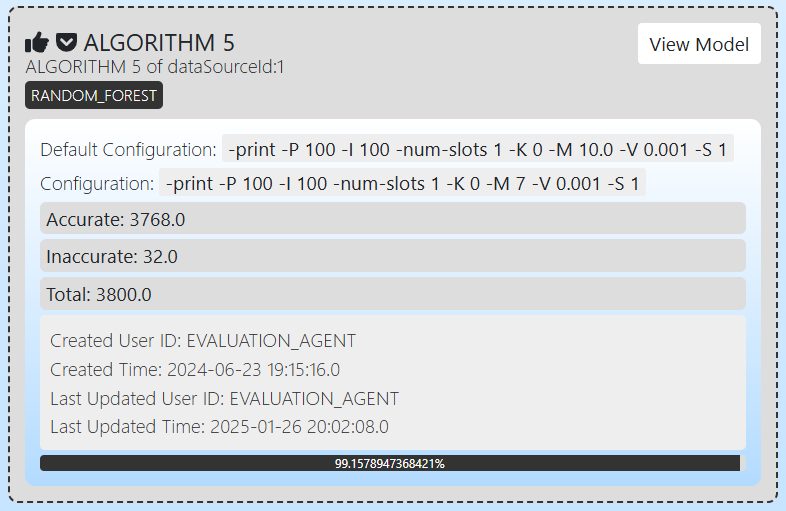
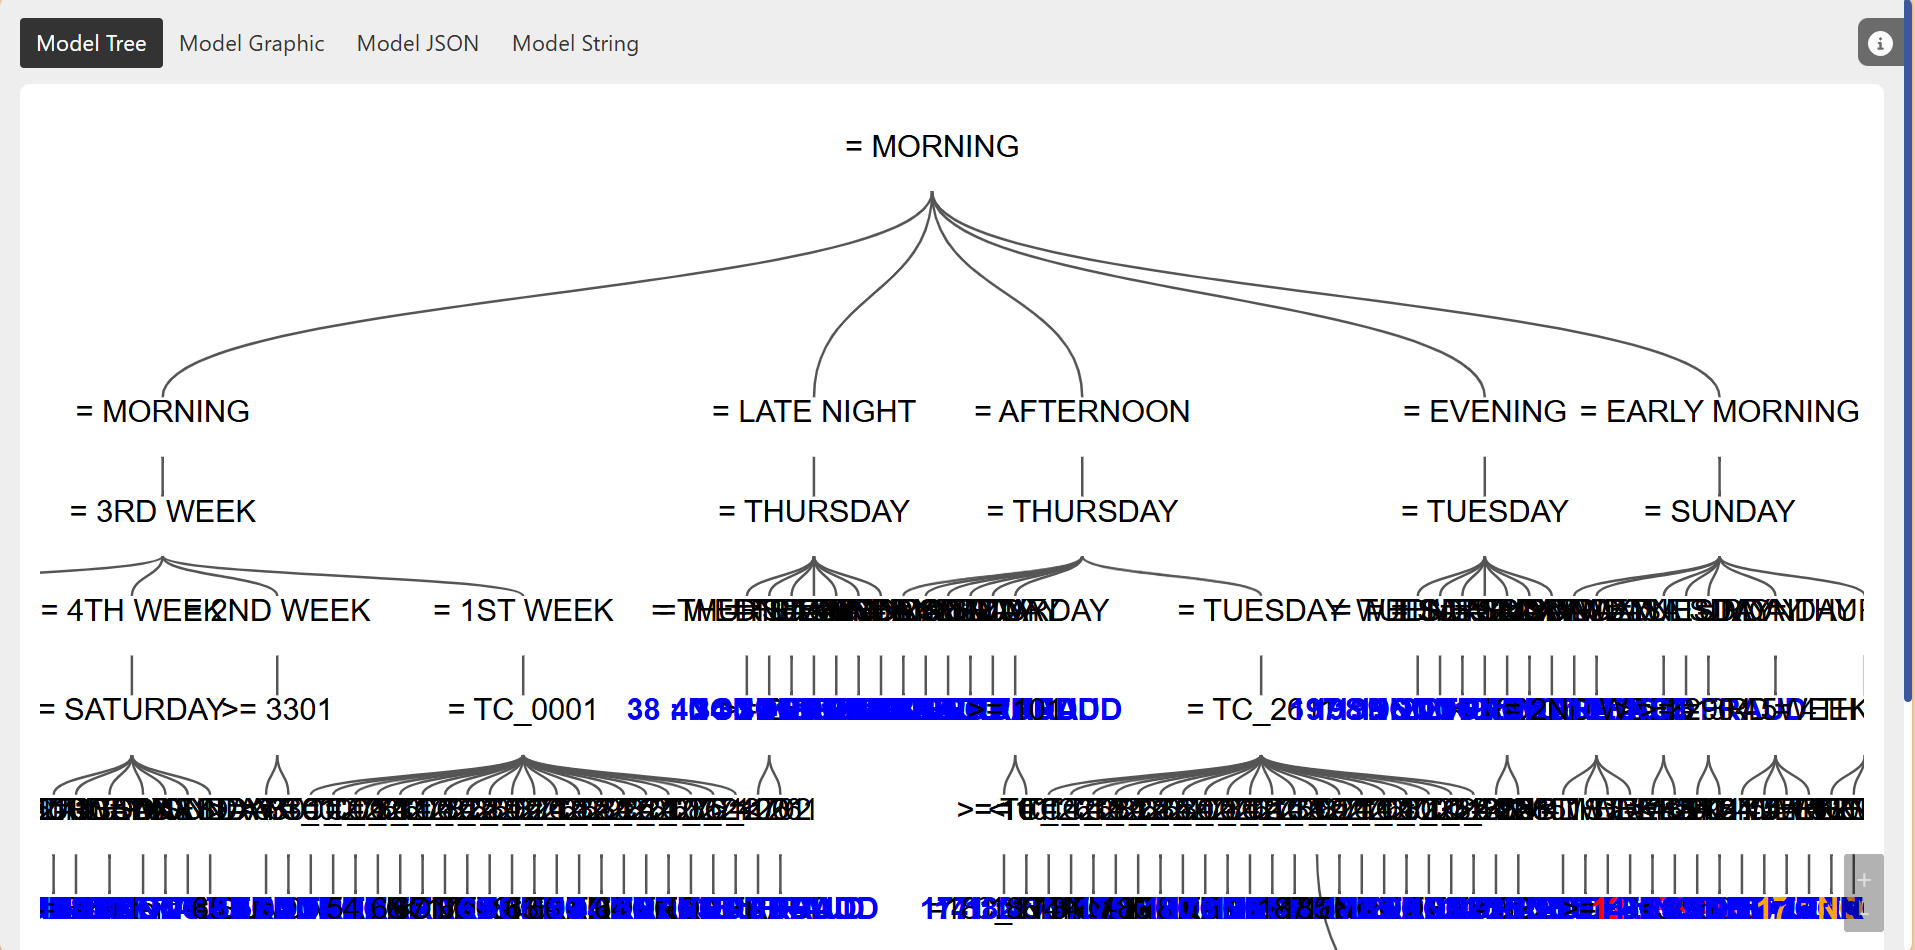
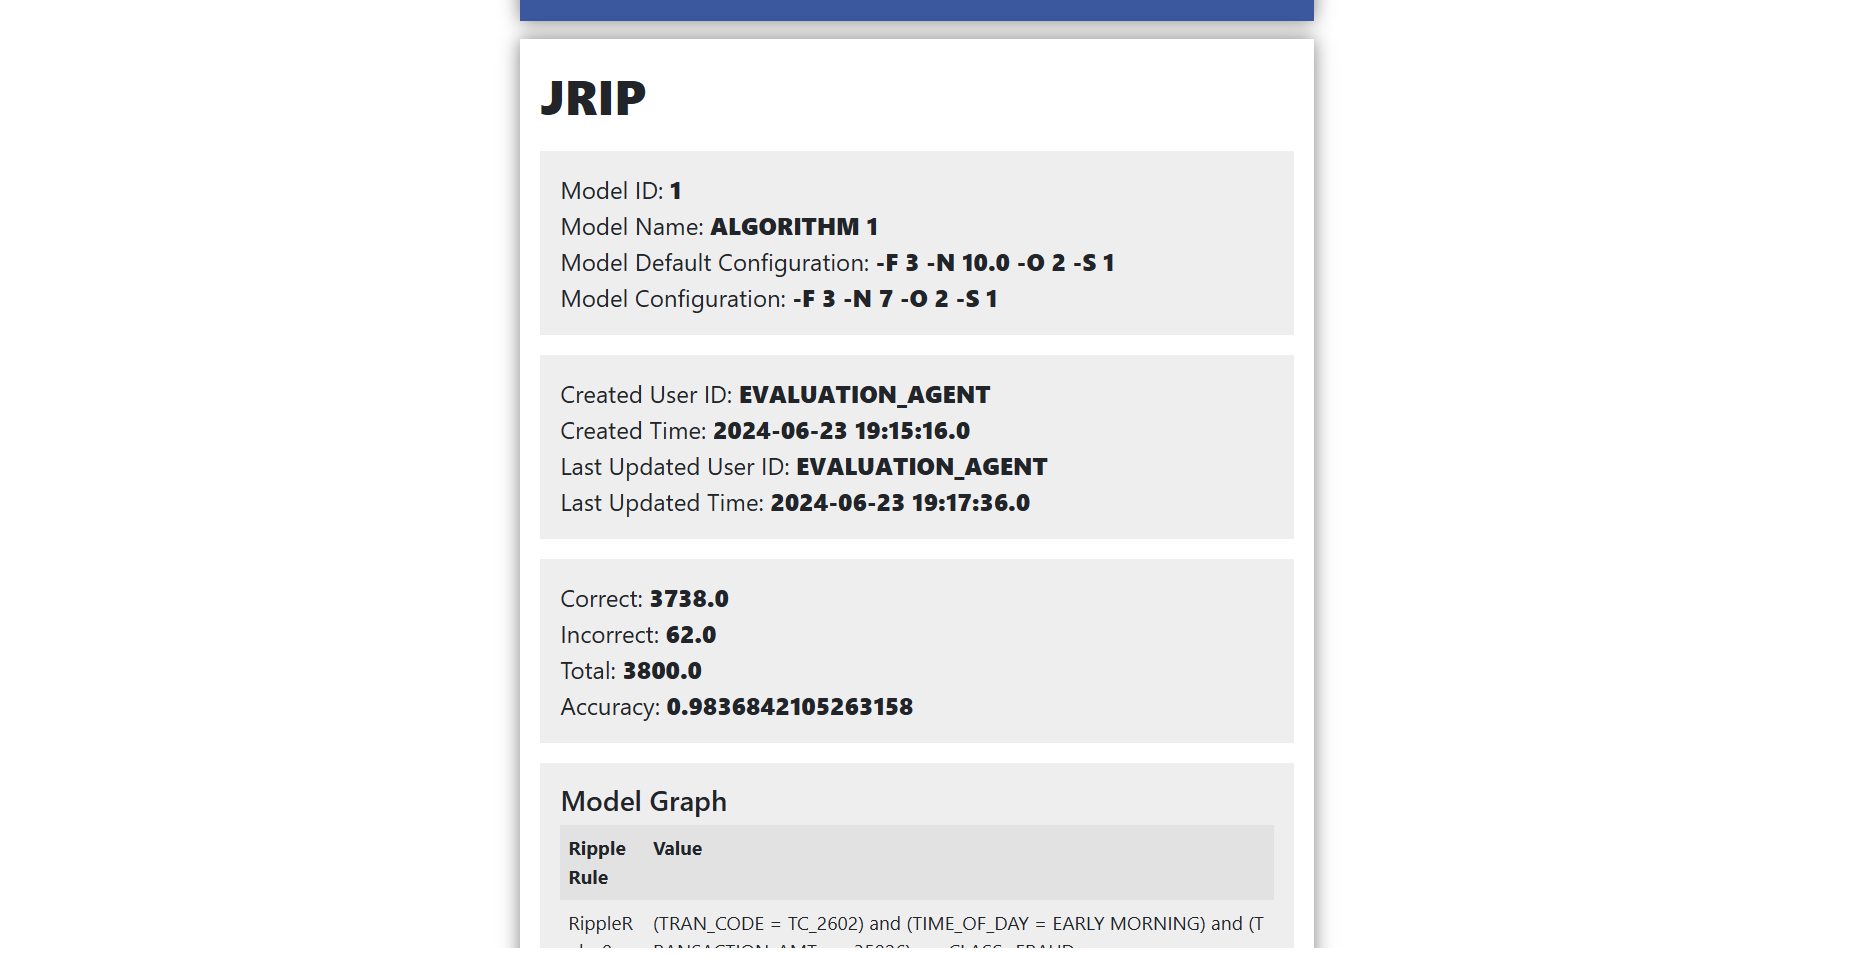
For more details on specific models, click the View Model button. Depending on the chosen algorithm, different types of visualizations are available. There are four main types of visualizations:
Model Tree – Available for tree-based algorithms (such as Decision Trees, Random Forests, etc.), this visualization displays the decision structure in a tree format. Nodes represent decision points, and branches represent outcomes. It’s a useful way to understand how decisions are made in a hierarchical structure.
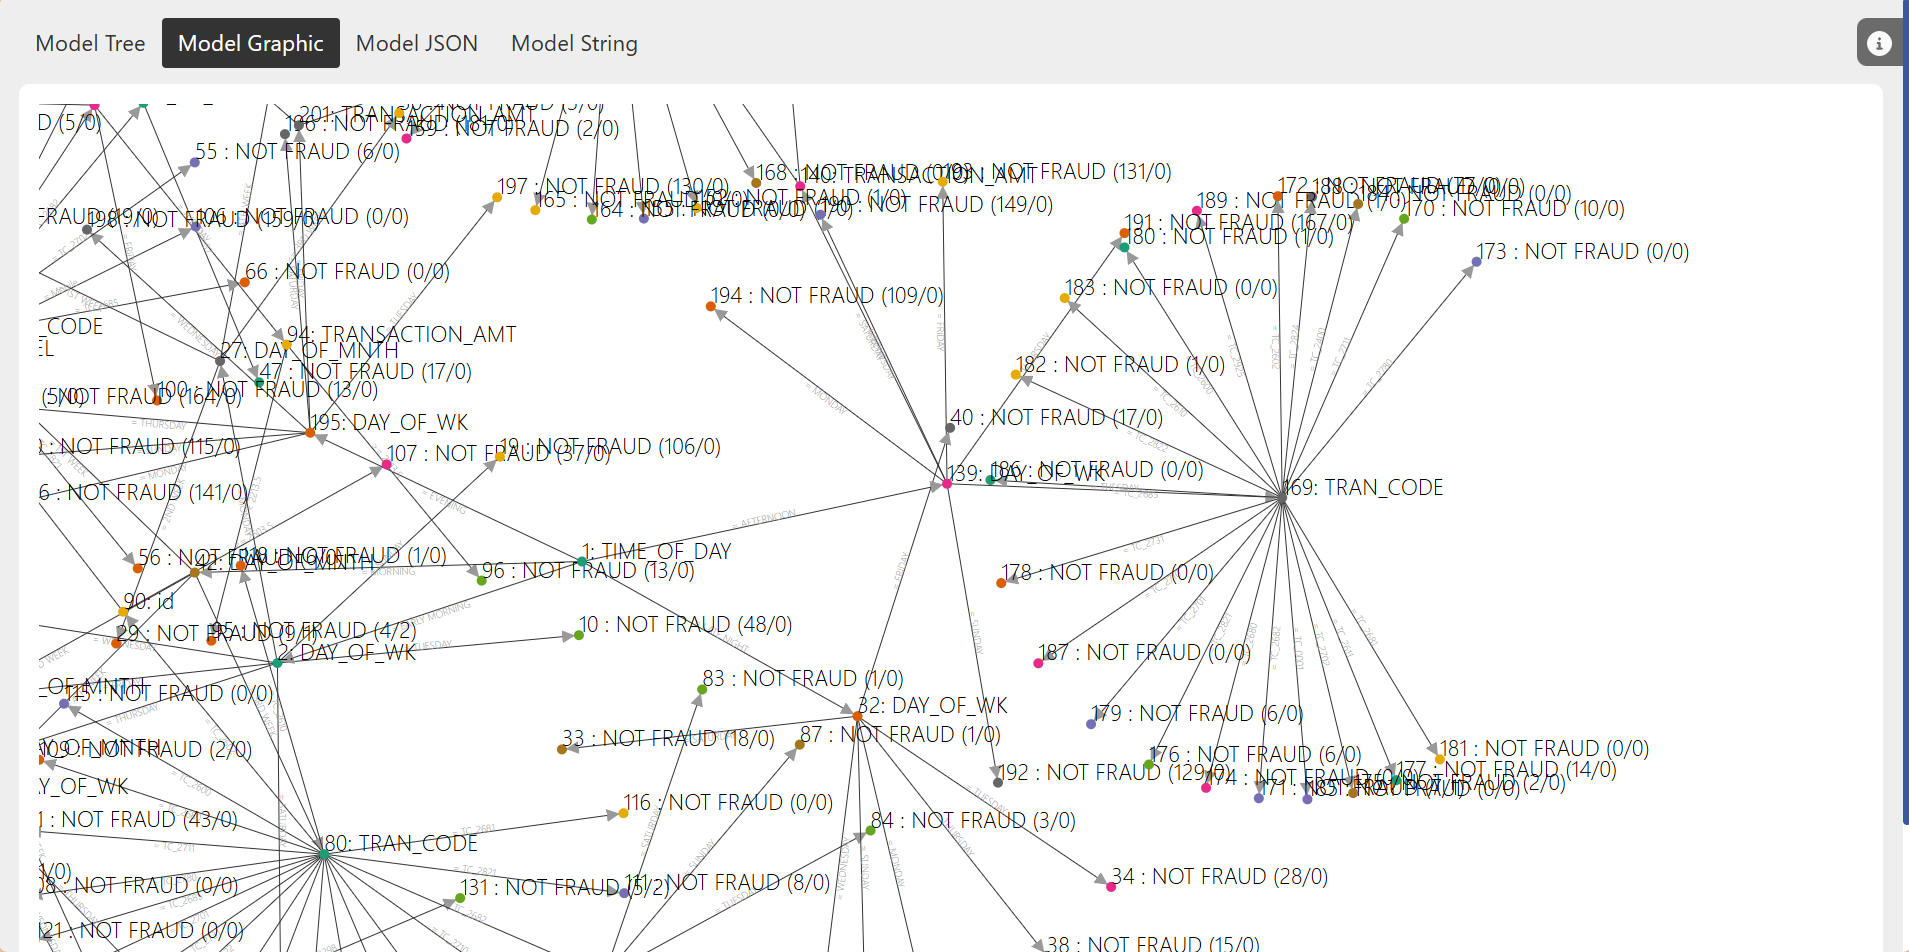
Model Graph – Also available for tree-based algorithms, this visualization presents the model as a graph with draggable and zoomable nodes. It offers an interactive way to explore the relationships between the model’s features and decisions. Hovering over nodes provides additional information about each decision point.
Model JSON – This format provides the model data in a structured JSON format. It’s ideal for understanding the raw, machine-readable representation of the model. This view is generally available for all algorithms, but the content will vary depending on the algorithm’s characteristics.

Model String – This visualization represents the model in a readable string format. It can be helpful for understanding simple models or for quickly accessing a textual description of the model without the need for complex visualizations.
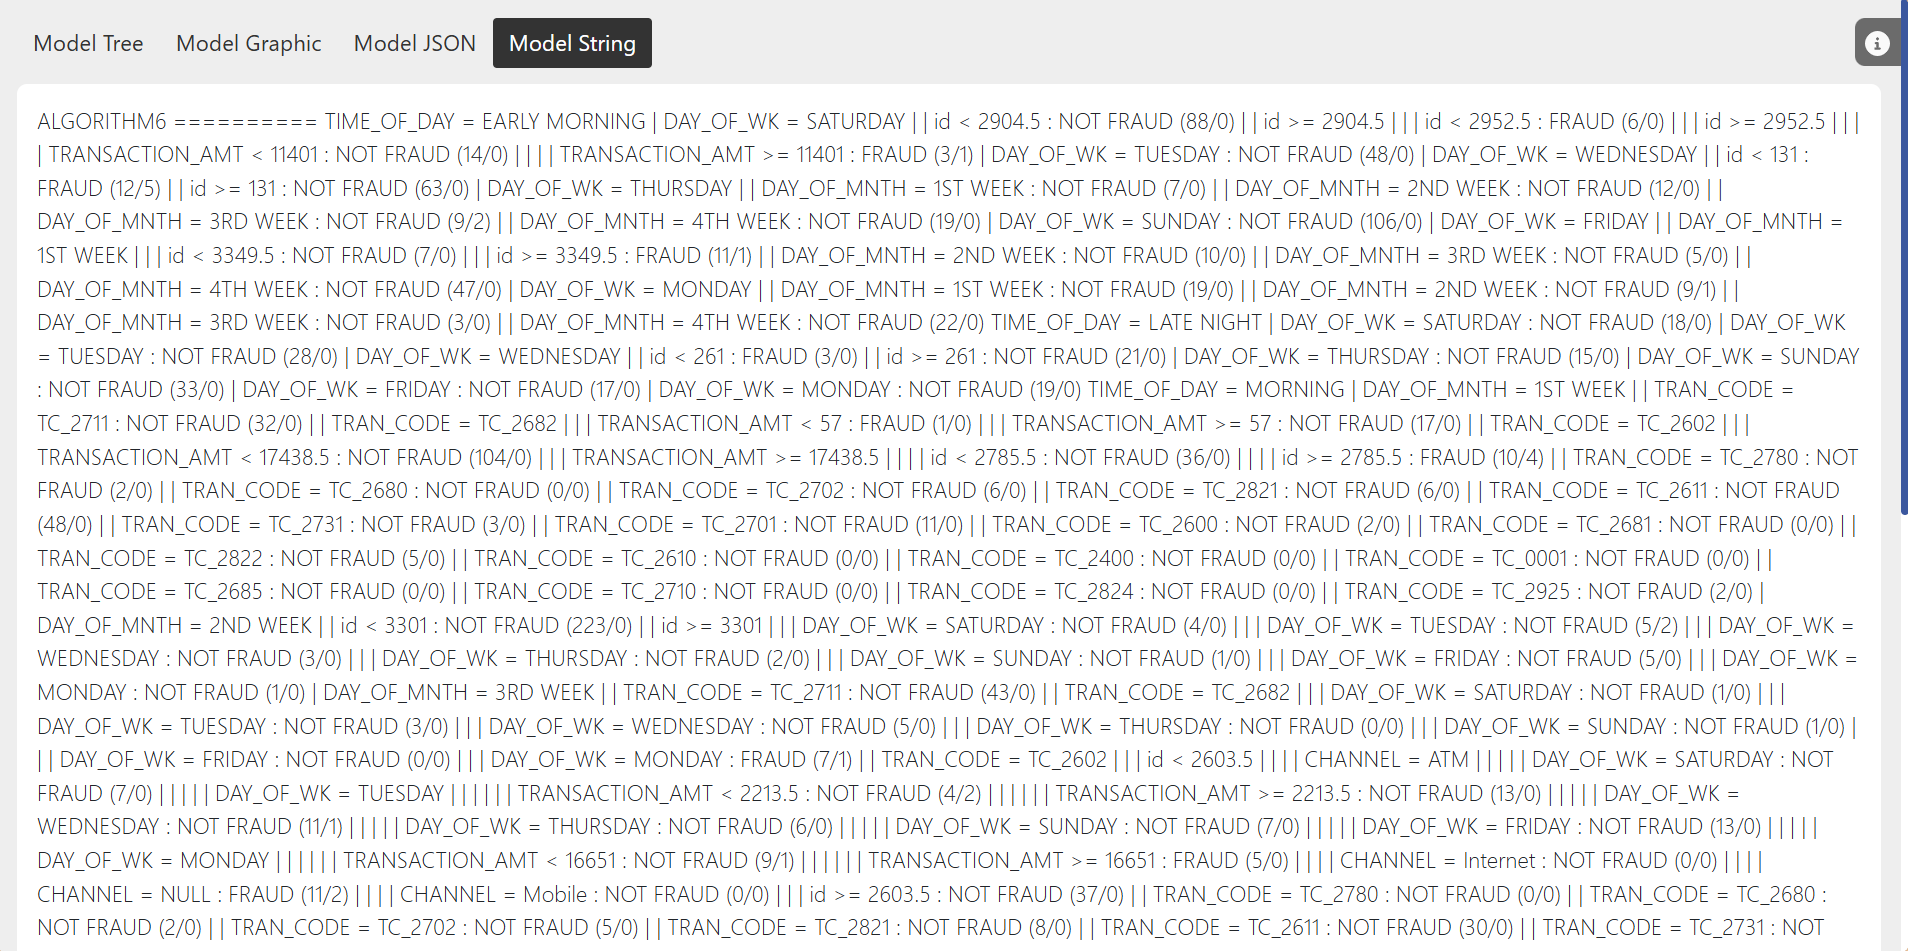
Different algorithms might display different visualizations depending on their nature. For example, tree-based algorithms will tend to offer all of visualizations including both the Model Tree and Model Graph, while other algorithms may only provide the Model JSON and Model String views.
To further explore the performance of each model, navigate to the Models Report page by selecting the Models Report button. This page will provide an overview of the model’s performance and help you compare them more effectively.
Additionally, the Switch to Query button enables the submission of SQL queries to retrieve data from the project’s associated training data source. This feature is available starting from version 2.0.16.
Project Evaluation
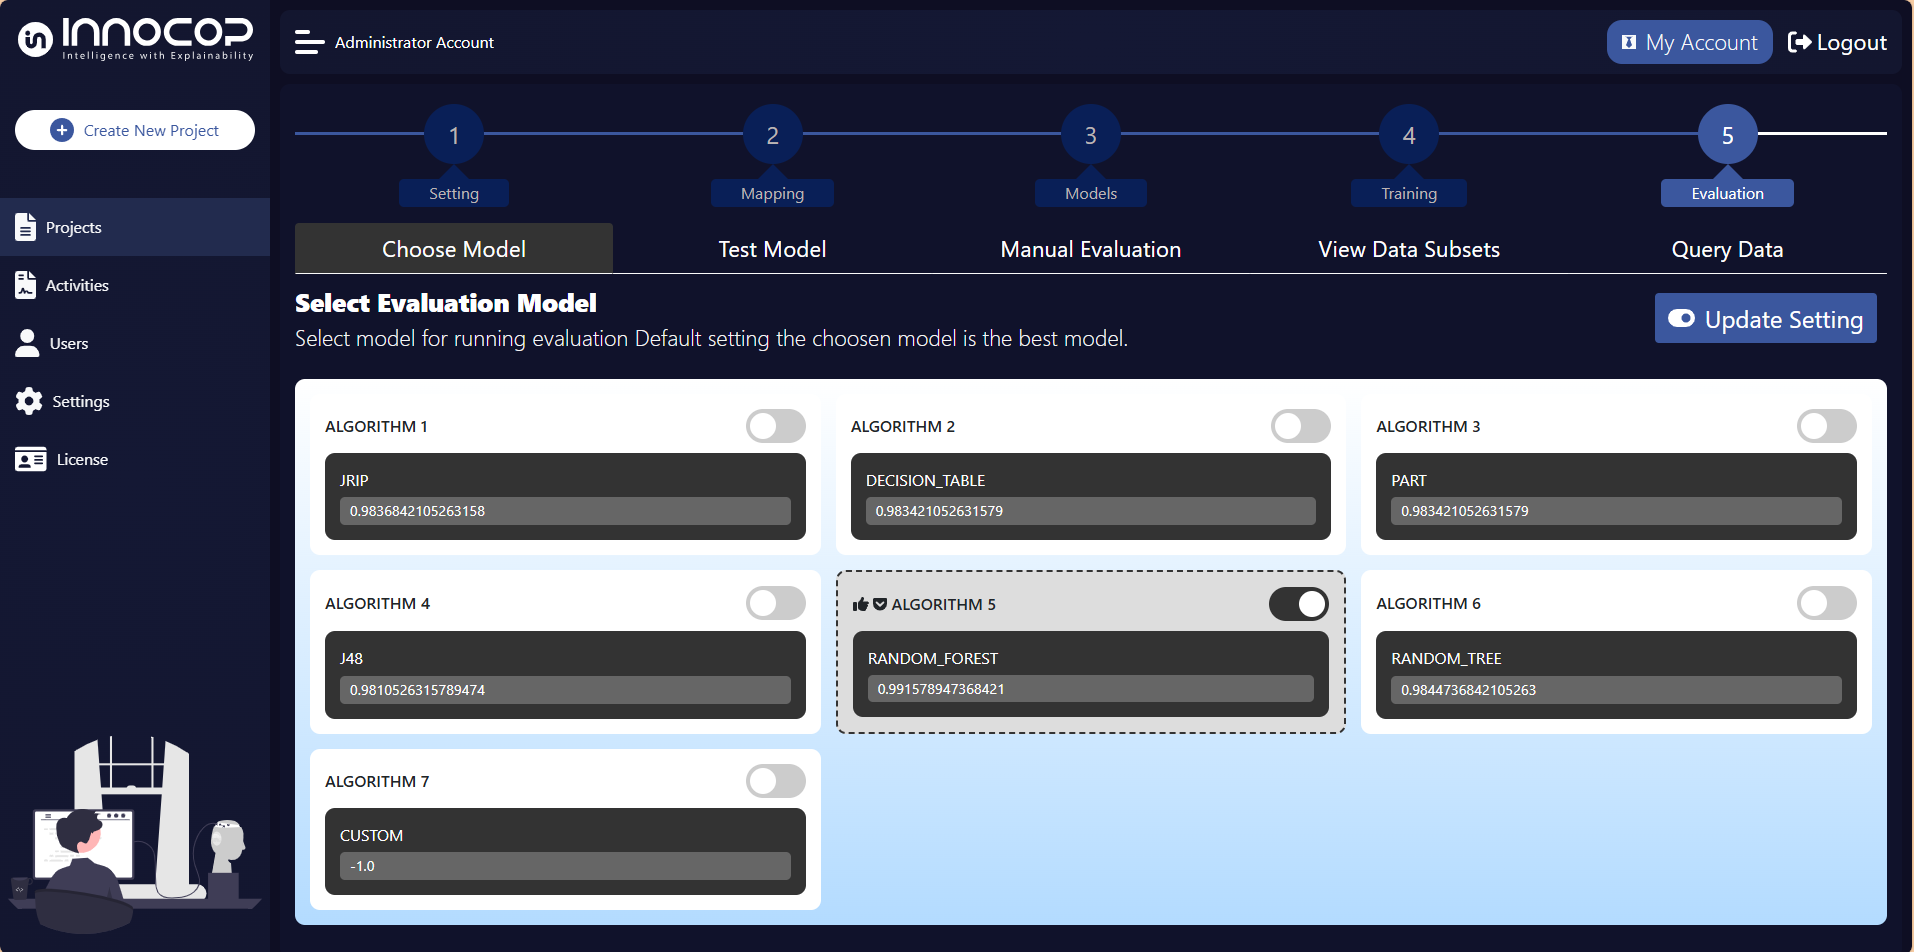
Update Selected Model
To update the model used for evaluation, click the toggle button next to the specific model you wish to select. After selecting the model, proceed by clicking the Update Setting button. Once updated, the newly selected model will be used for data evaluation across all project evaluations.
Test Evaluation
To initiate a test evaluation of the project’s model, fill in all required fields and select the Test Evaluation button. The Test Evaluation feature allows you to evaluate the inputted dataset without saving the results to the evaluation data source in the database. This enables you to test the model’s performance on new data without affecting the stored evaluation data.
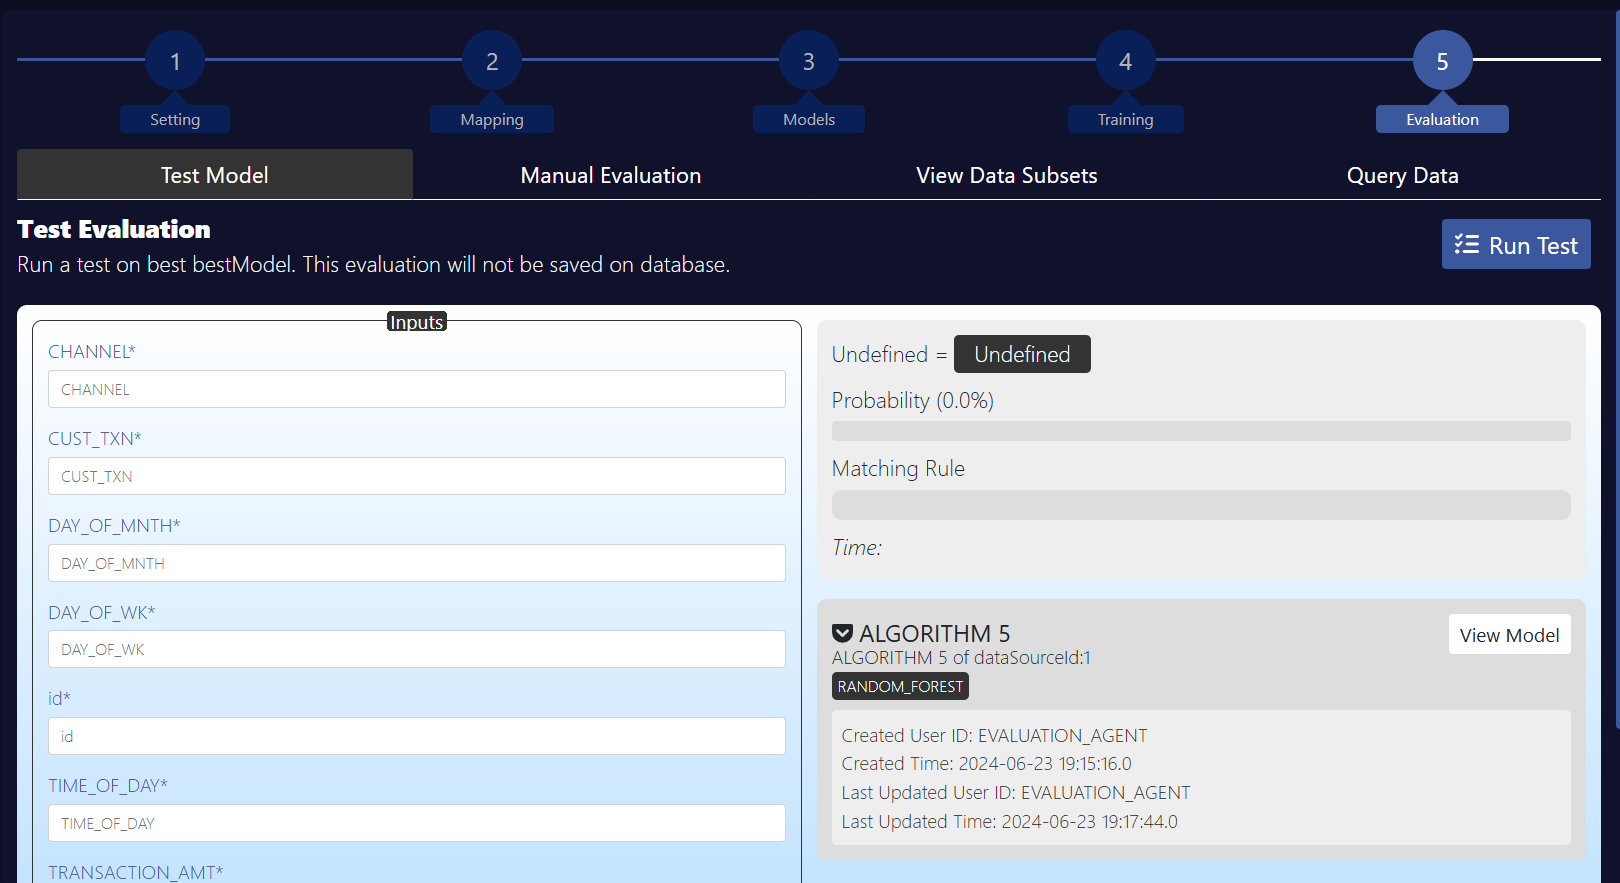
The output of the Test Evaluation will consist of three key fields:
Output Class: Displays the class assigned from the evaluation, such as Approve/Reject, Fraud/Not Fraud, etc.
Probability: Shows the probability of the assigned output class.
Matching Rule: Provides the rule from the algorithm that matched and determined the output class.
For all Default models, these three fields will be populated with values. If a Custom Model is used, the Probability and Matching Rule values will depend on the output returned by the custom model evaluation.
If the output from the custom model evaluation does not include values for Probability and Matching Rule, the Probability will default to -1, and the Matching Rule will be marked as N/A.
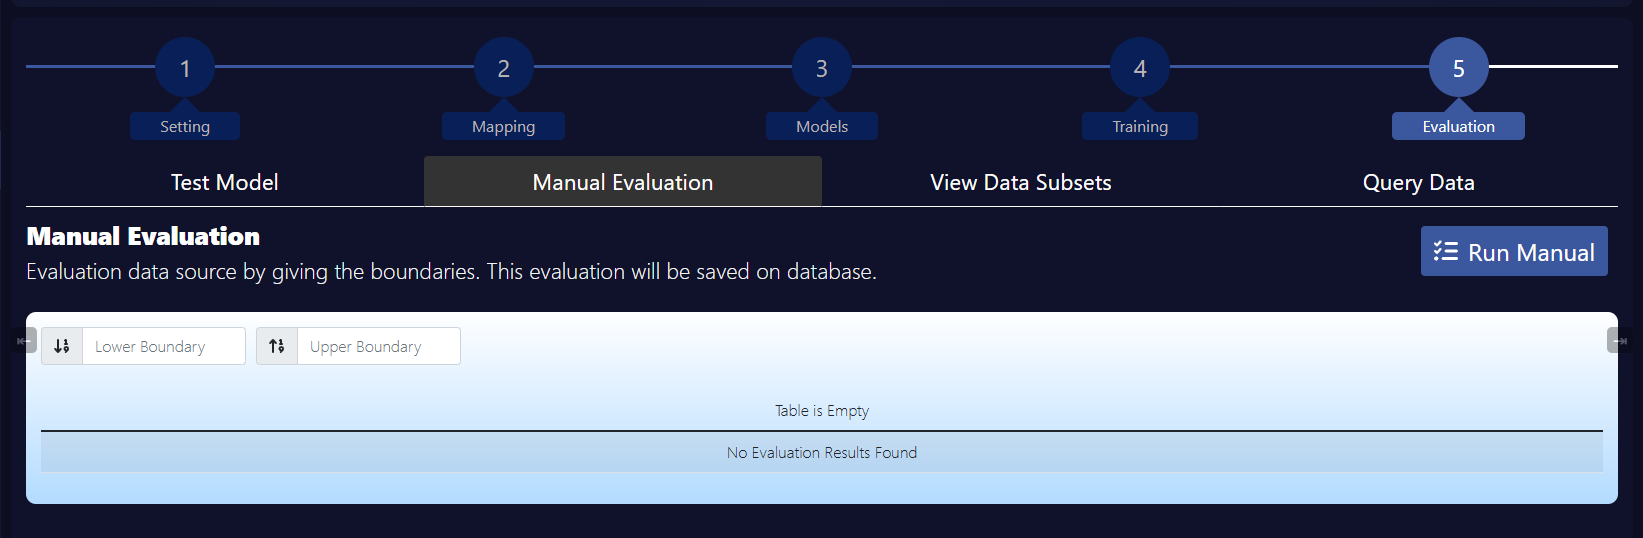
Manual Evaluation
The Manual Evaluation feature is designed to allow users to retrieve specific rows of data from the related evaluation data source and perform an evaluation using the previously selected model. This method is typically used when incoming transactions are not automatically evaluated by the automated evaluation agent.
This feature gives users the flexibility to manually evaluate data that may not be processed through the automated pipeline, ensuring that no transaction is left unexamined.
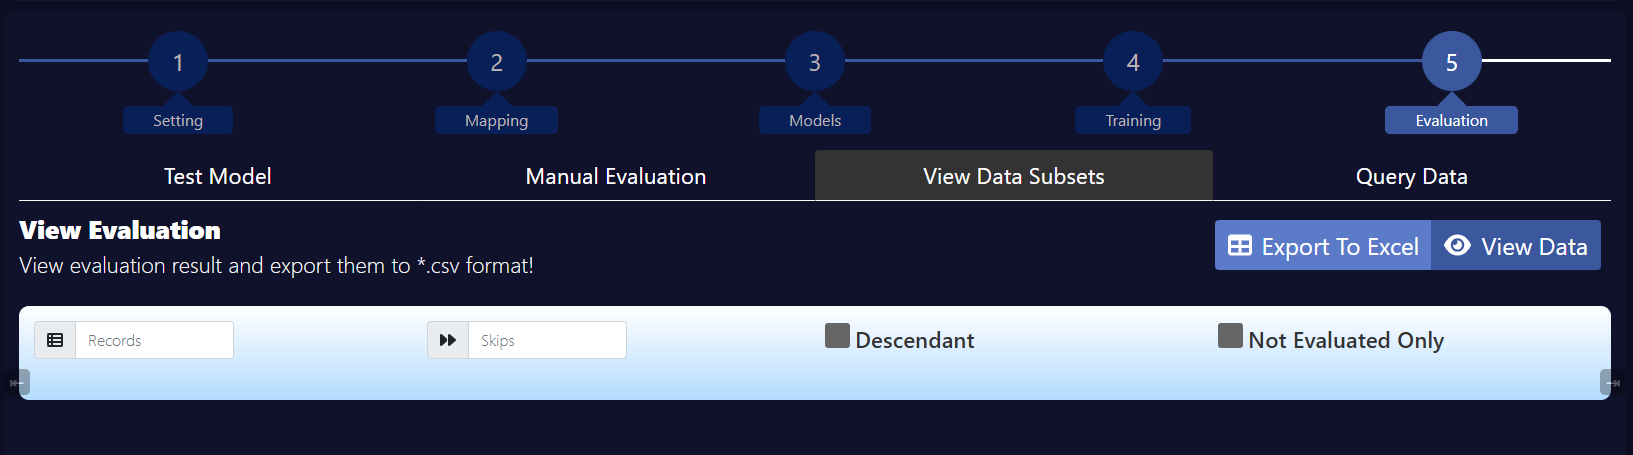
View Data Subsets
The View Data Subsets feature allows users to retrieve specific data from the related evaluation data source. It offers four key fields for customizing the query:
Records: Specifies the number of rows to retrieve, effectively setting a LIMIT for the SQL query.
Skips: Defines how many rows should be skipped, corresponding to the OFFSET in the SQL query.
Descendant: Determines the order in which the data is arranged (sorting order).
Not Evaluated Only: Filters the data by including only rows that have not yet been evaluated, which is applied as a WHERE clause in the SQL query.
This feature provides flexibility in retrieving and reviewing specific subsets of data for evaluation, especially when data processing needs to be selective or targeted.
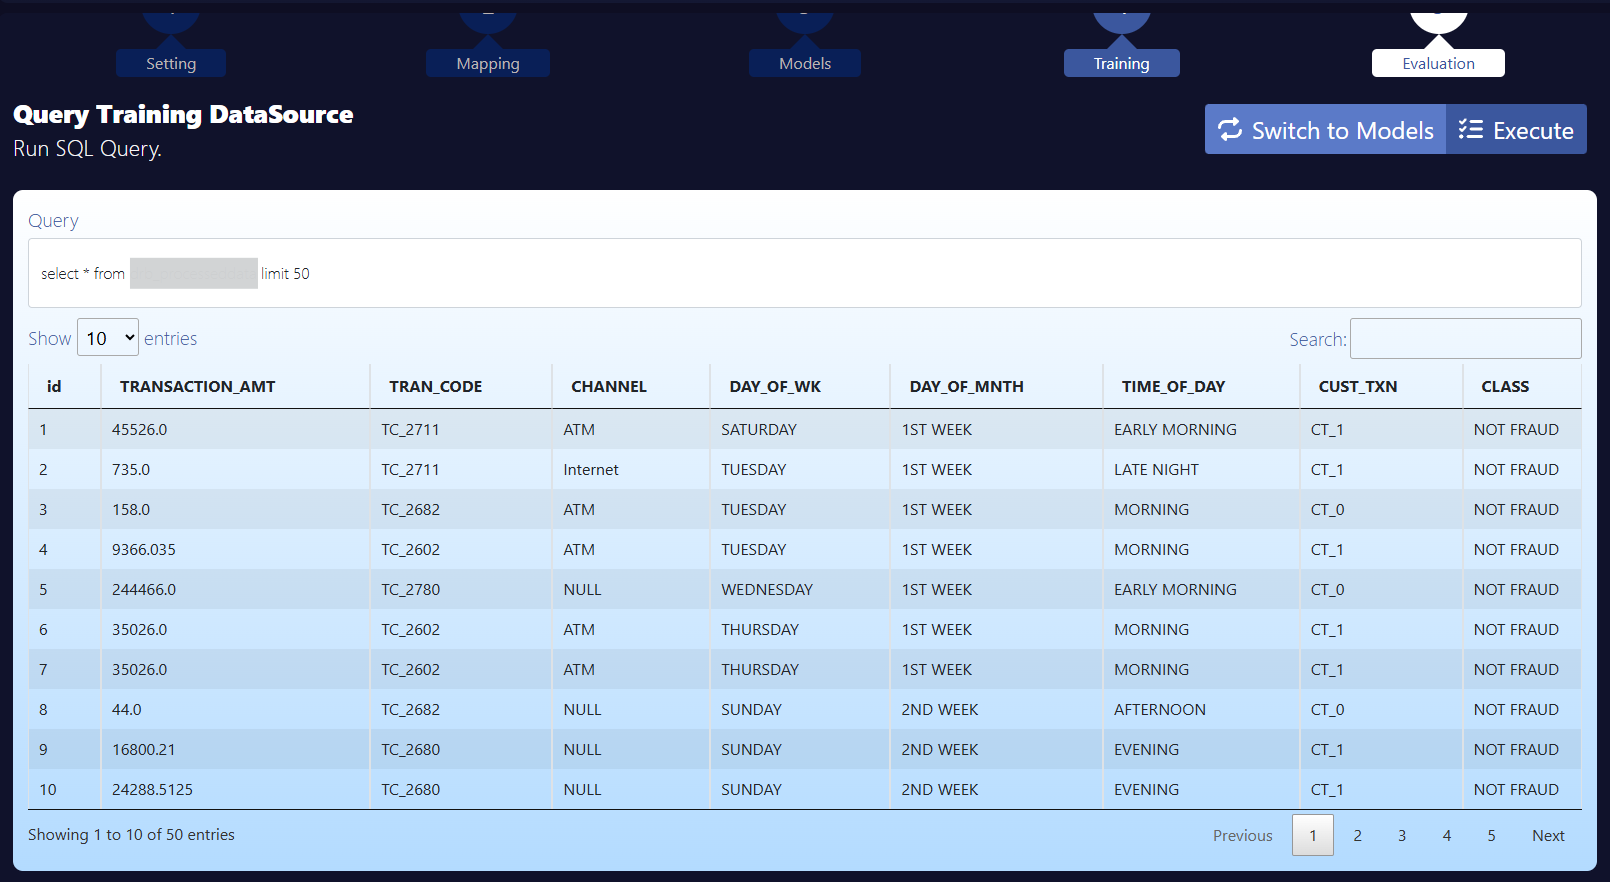
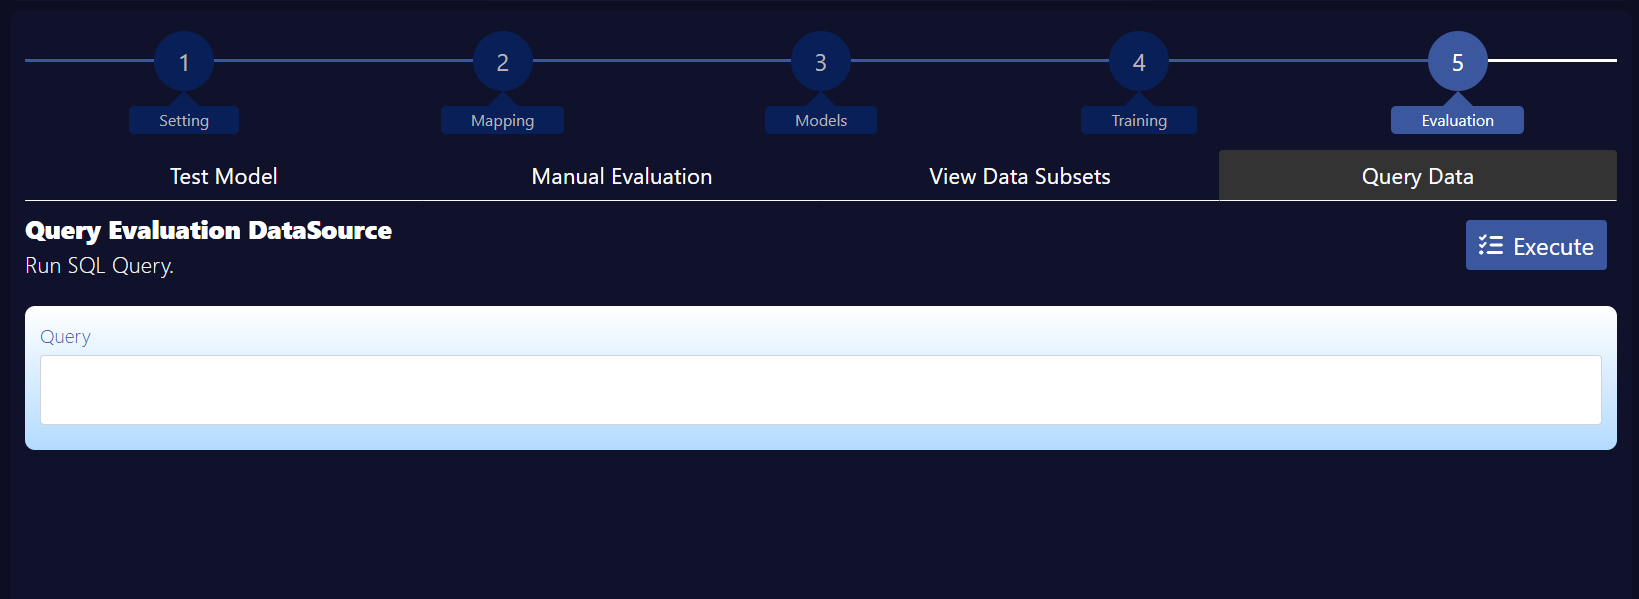
Query Data
The Query Data tab allows users to submit SQL queries to retrieve data from the project’s evaluation data source. This feature is available from version 2.0.16.
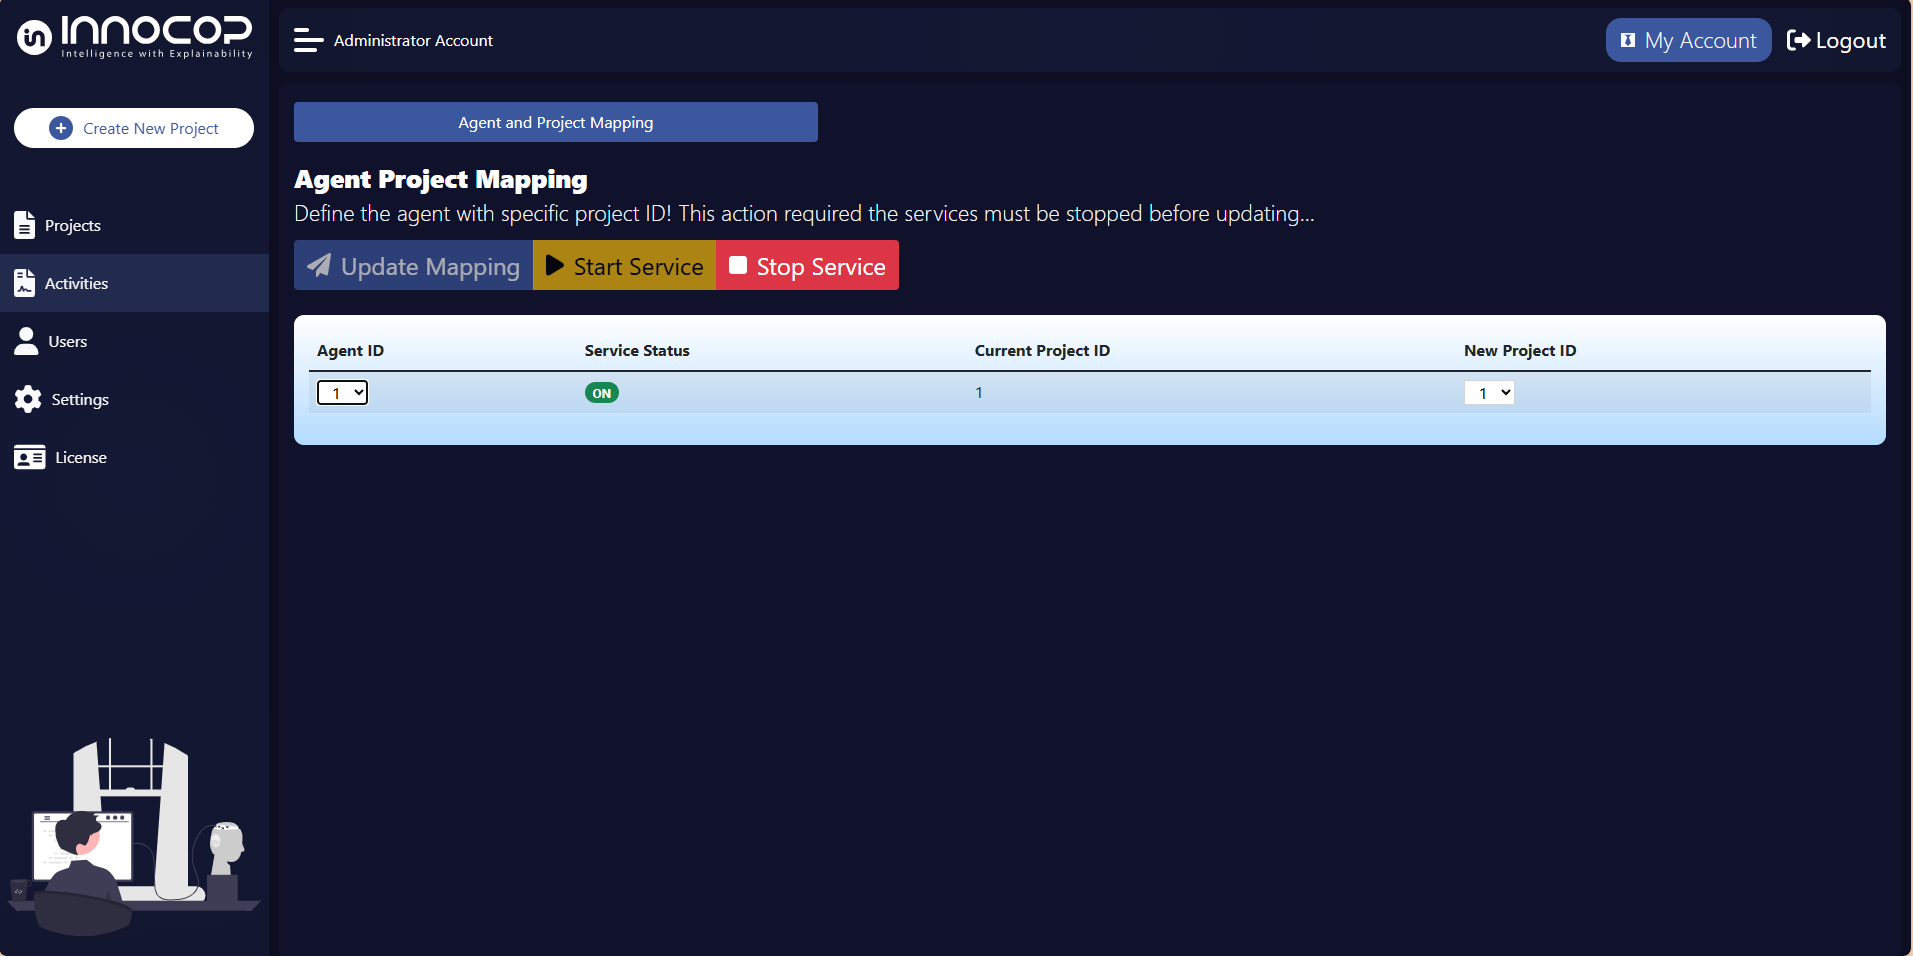
Activities
When an agent is assigned for automated evaluation within a project, it will appear on the Activities page. To activate or deactivate the agent, click the Update button. To start the agent and monitor its activities, click the Start button.